Different IR Measurements can be averaged in order to get specific single measurements and those averages can be plotted on graph along with measured sessions and compared.
There are there types of Averaging
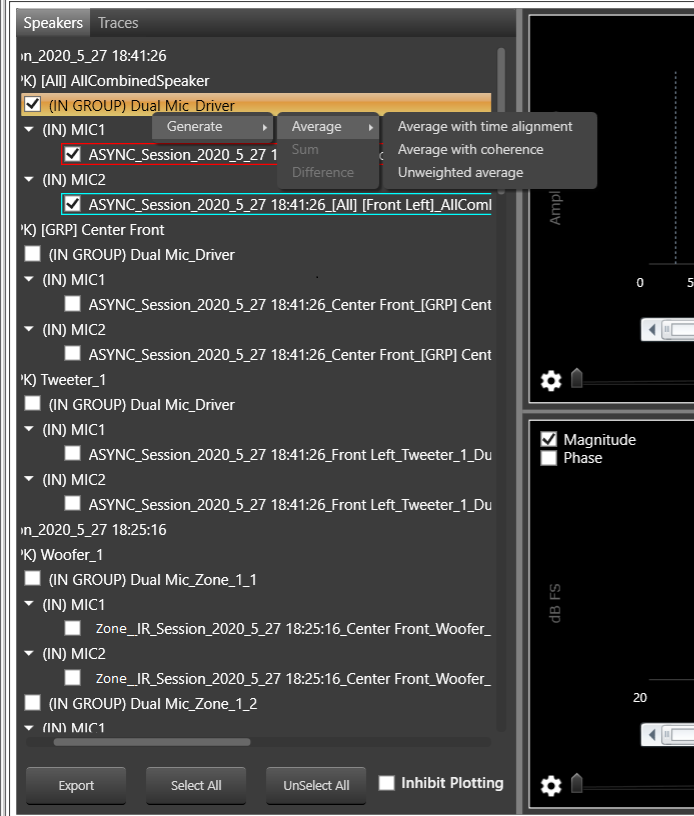
- Average with time Alignment
- Average with coherence
- Unweighted average
Right click on In Group to open context menu to Generate Average
On click of any type of average a window will pop up to enter average curve name
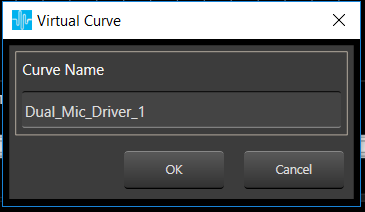
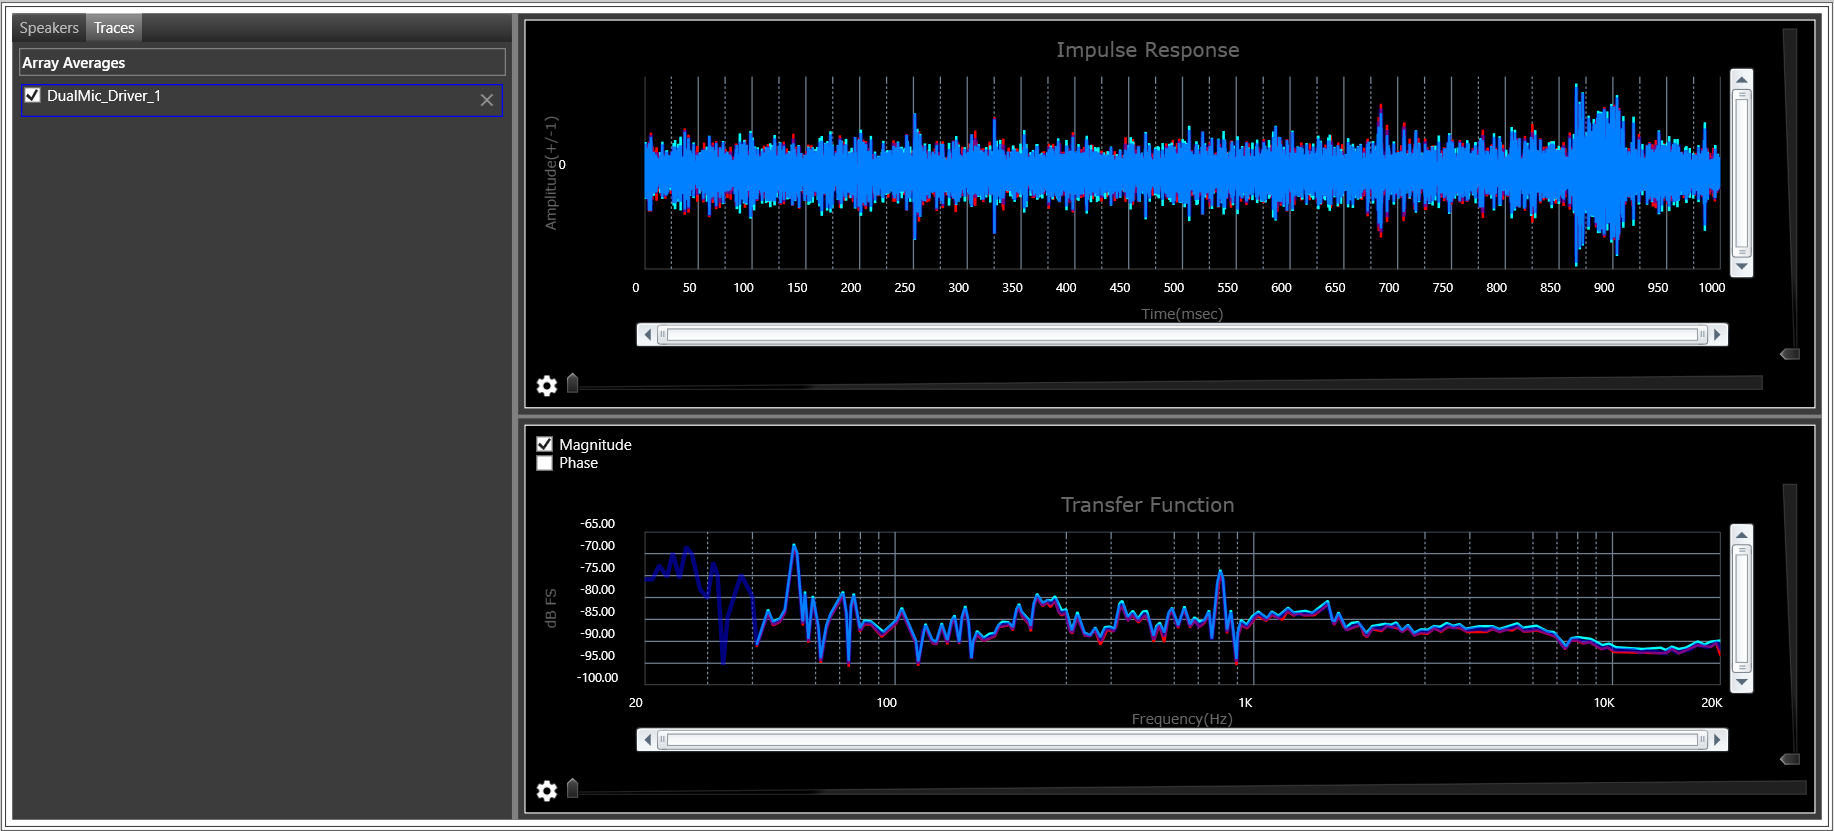
On click of OK , average of selected mics will be created and Time Response and Frequency Response are plotted on graph , Created average curve can be seen in Traces tab under Array Averages.
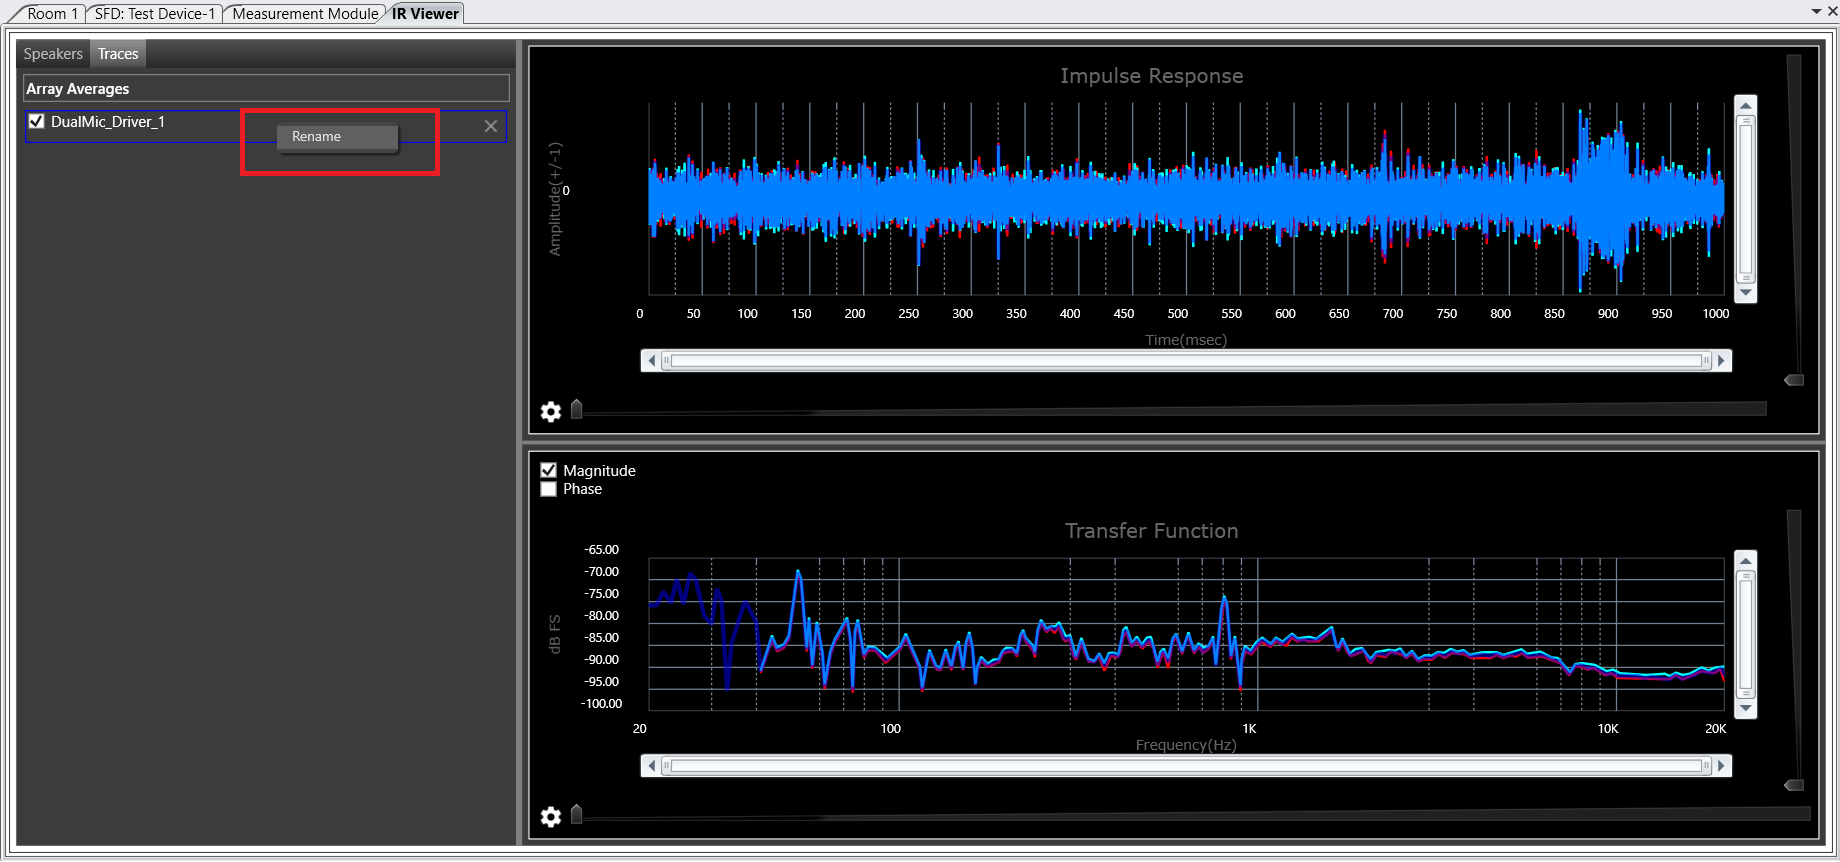
Already available average curves can be renames using context menu , On Rename a window pop up will open and new name can be assigned there.