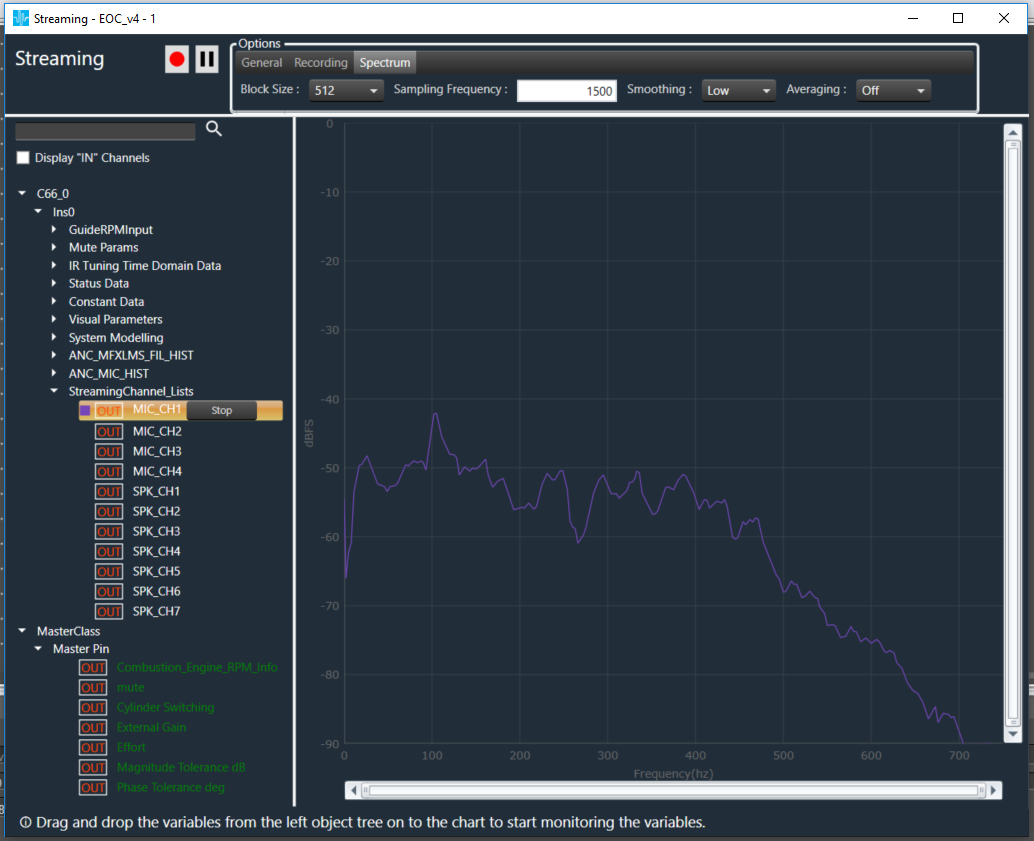
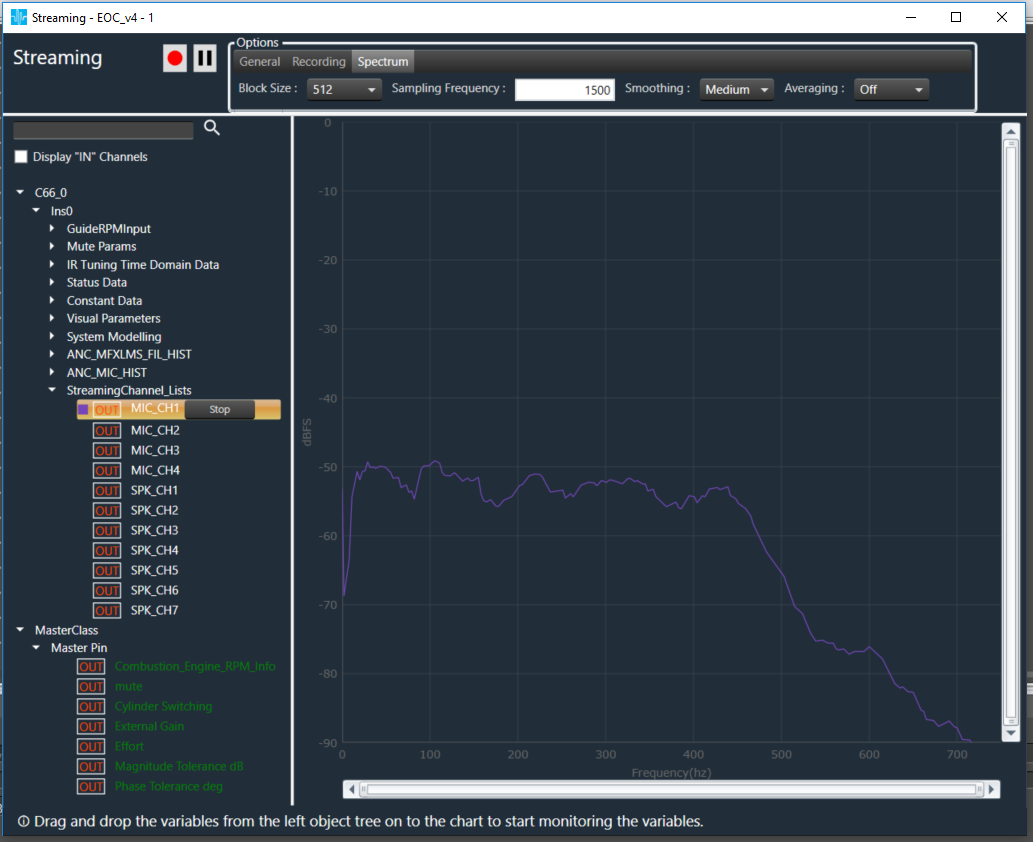
FFT Analysis capabilities are also available in the streaming window, wherein the FFT analysis of incoming audio signal is undertaken in real-time (depending upon the block size, additional calculations, etc)
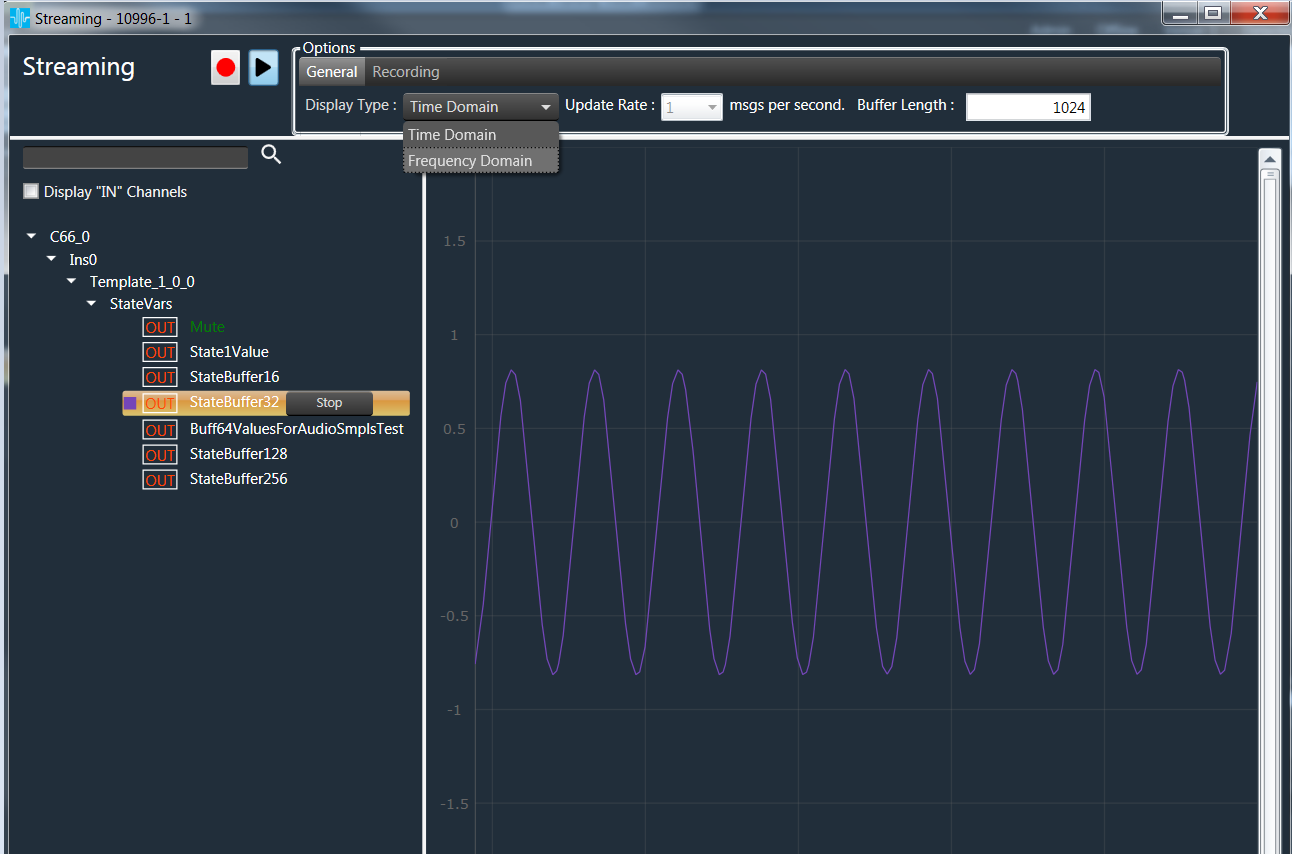
Display type selection under General Tab in Monitoring window will help to switch between Time/Frequency domain.
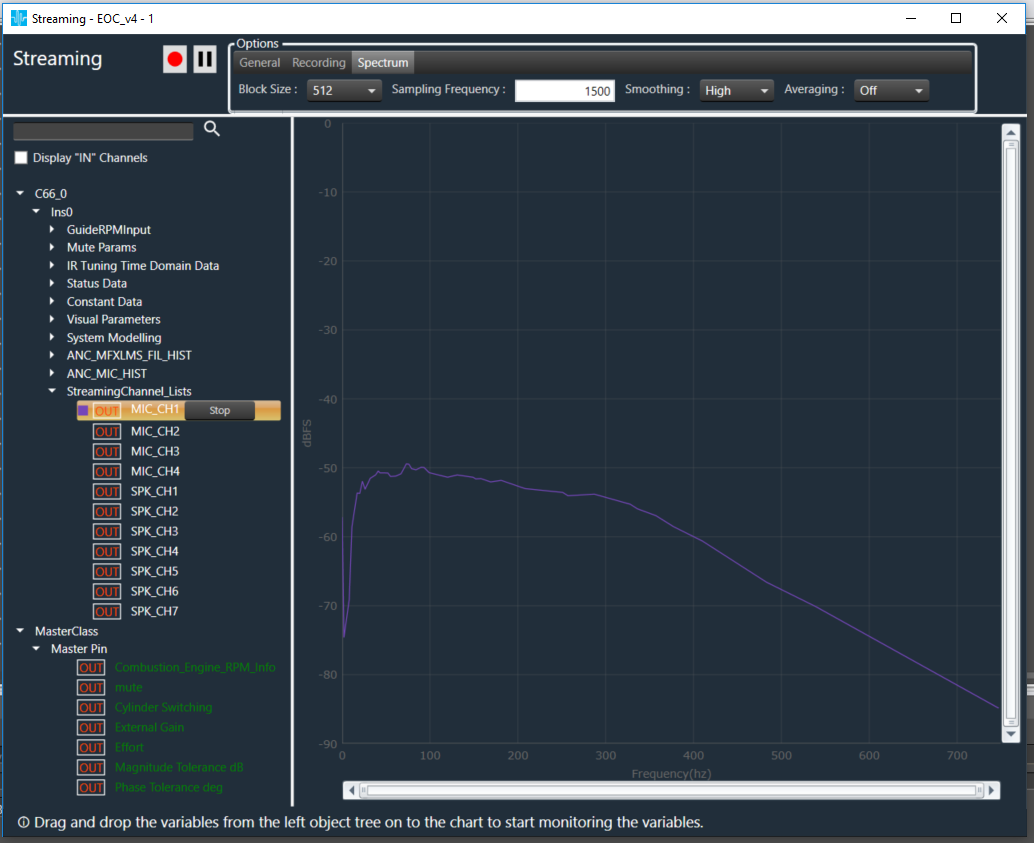
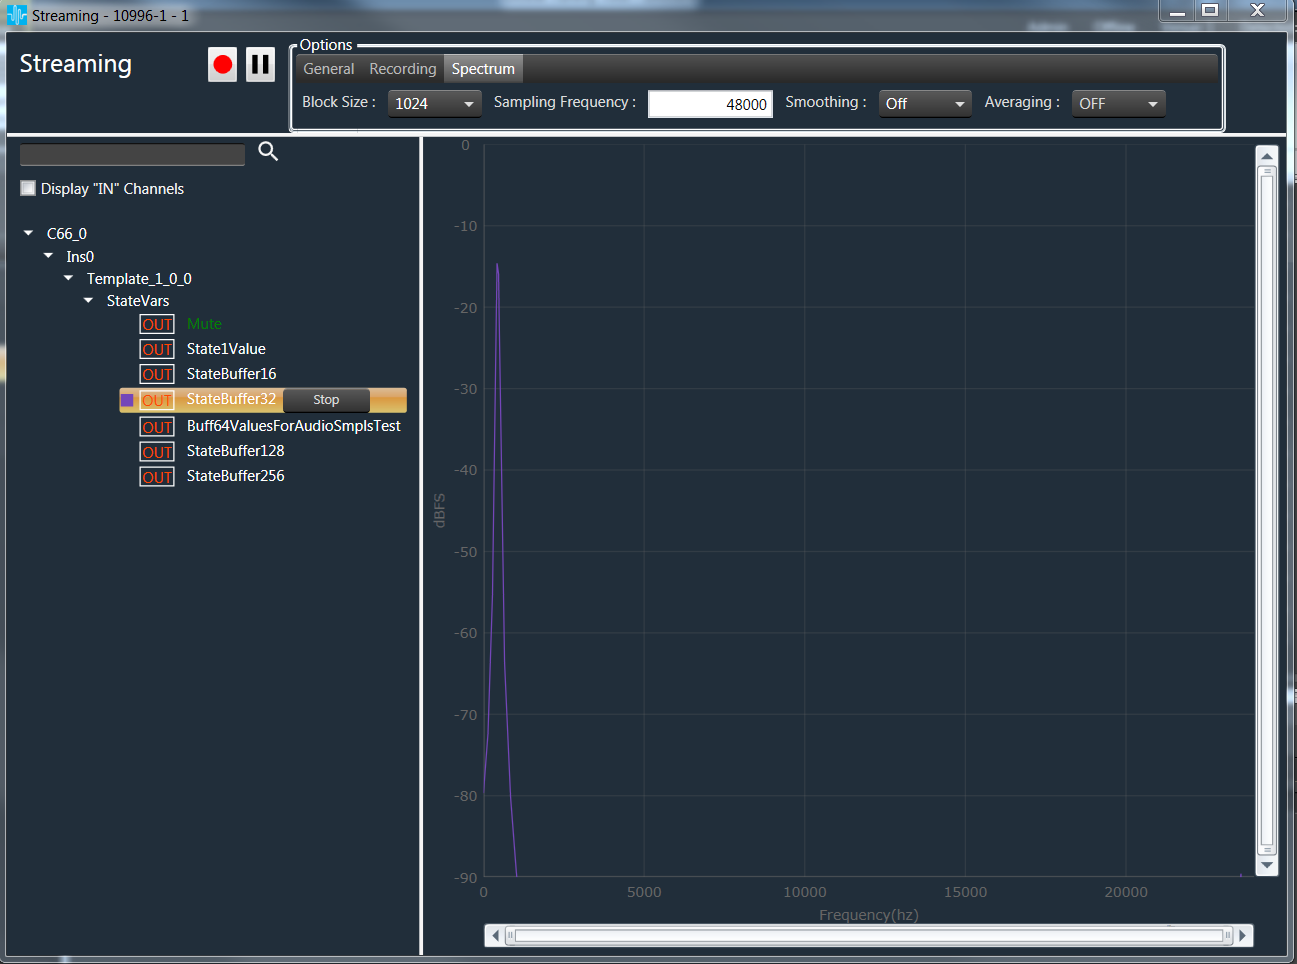
Spectrum of Streaming can be viewed by selecting the Display type as “Frequency Domain”
Spectrum view looks as follows with X-Axis ranges from “0 to Sampling Frequency / 2”, and Y-Axis ranges from “0 to -90 dbFS”.
Correct Sampling Frequency has to be provided by an audio engineer, which is nothing but streaming state variable sampling frequency .
Spectrum properties like Block(FFT ) size, Averaging, Smoothing etc are configurable under “Spectrum” Tab.
FFT averaging can be controlled by selecting Slow, Medium, Fast or Off(No averaging) option under “Spectrum” Tab.
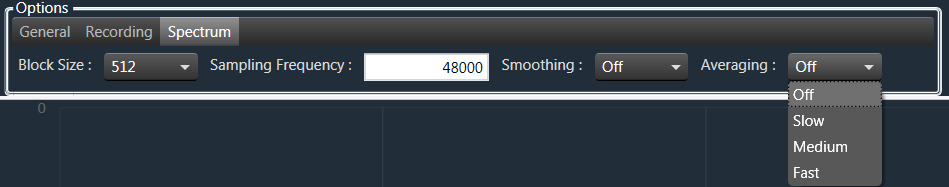
FFT smoothing can be controlled by selecting Low, Medium, High or Off (No smoothing) option under “Spectrum” Tab.
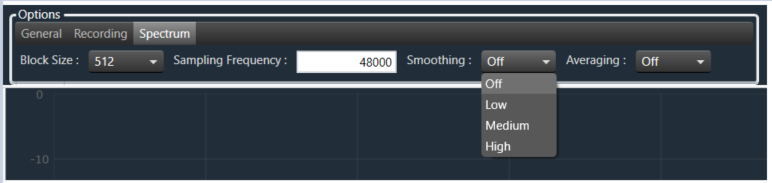
The variable “MaxWinSize“( 20-Low, 40-Medium and 1000-High ) decides window size to maximum. Bigger the numbers, the curve can get smoother. If you limit to e.g. 500 Hz, all bins in the upper frequency range will be smoothed by averaging with a 500 Hz wide window.
Smoothing : Off

Smoothing : Low
Smoothing : Medium
Smoothing : High