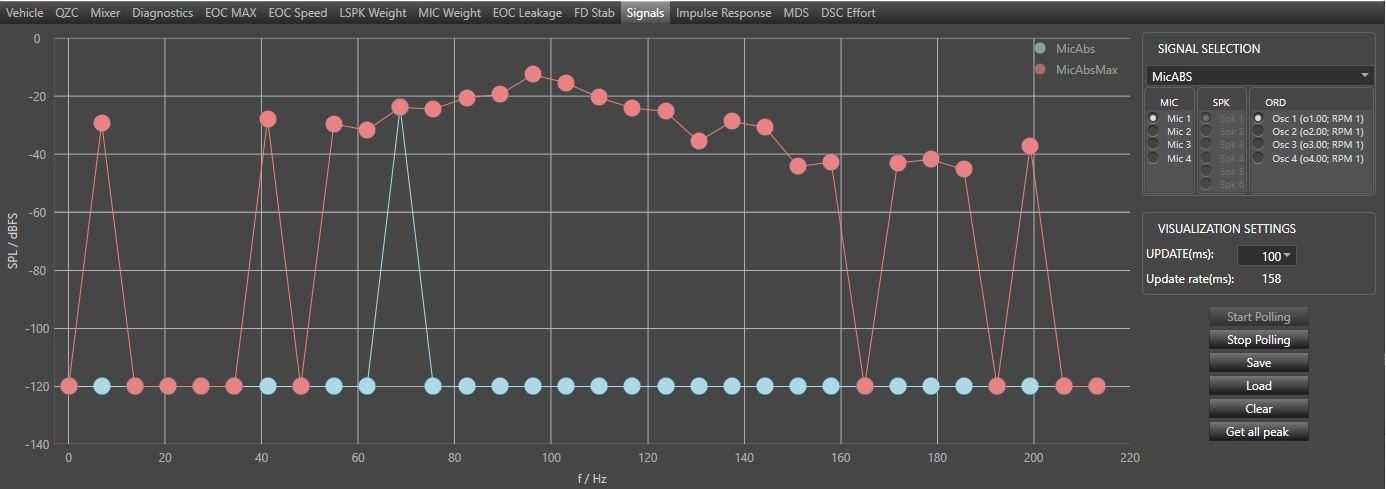
This tab is used for measuring selected type of signal
- Blue plot – actual values
- Red plot – peak hold values (based on the actual values received by GTT)
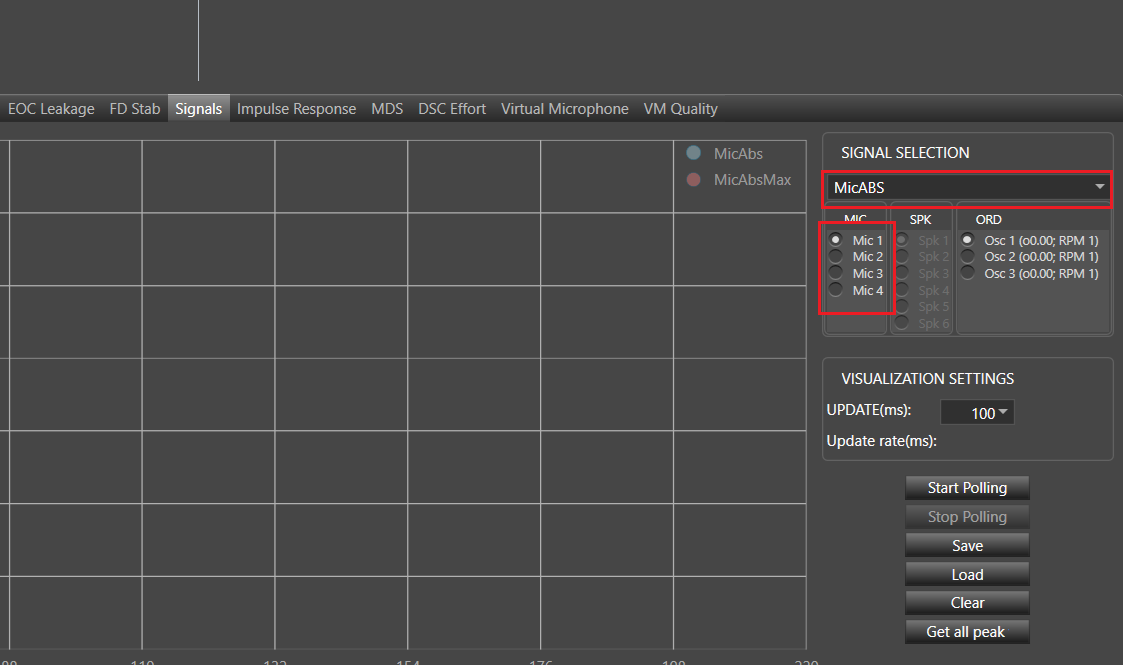
Signal Selection
- Drop down – changing selected type of signal
- Combo boxes Mic, SPK, ORD – to select proper mic, spk or order. Available in selected type of signals
Visualization Settings
- Update (ms) – intervals of chart updating
- Update rate (ms) – time between reads
- Start Polling / Stop Polling – start/stop updating chart
- Load – load data from file to selected signal
- Save – save data (for all mics/spk/ord) for selected signal
- Clear – clear data
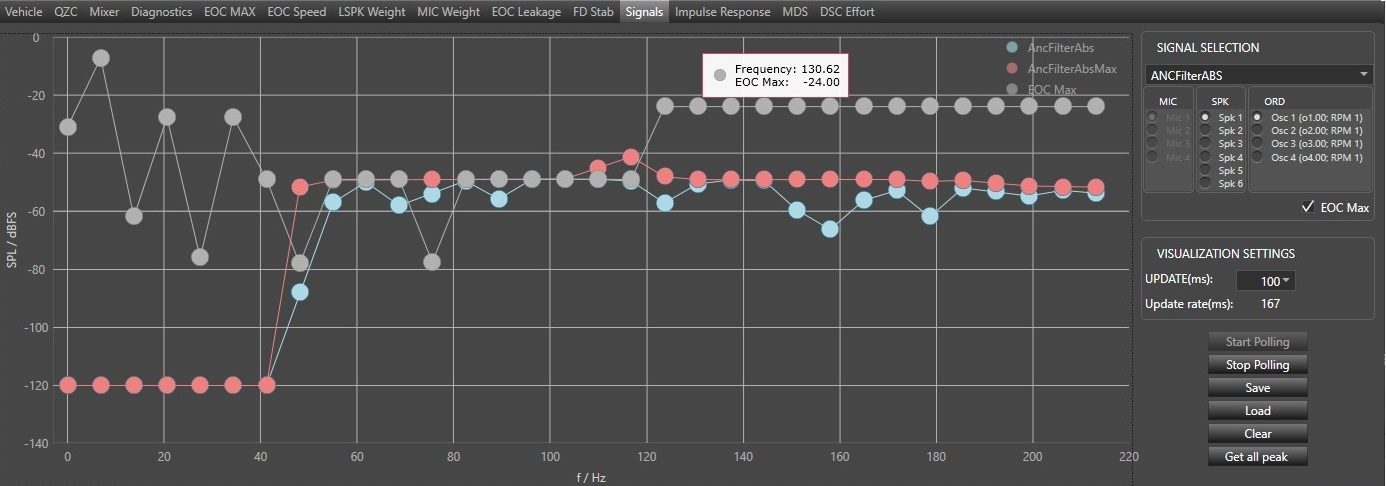
EOC Max data
Displaying EOC Max data directly on the signals graph is possible by selecting EOC Max check box when ANCFilterABS signal is selected.
The EOC Max data are retrieved from EOC Max panel and overlay on the chart as an additional grey series.
Make sure the number of microphones in Signals – MicABS is equal to m_TuneMicNum. If Vm Config is disable then m_TuneMicNum is equal to m_NumElement(# of Mic:) and if Vm Config is enable then m_TuneMicNum is equal to Num of Virtual Mics(from Additional Parameter section).