Click on “Open CPU Profiling window” in order to open the Profiling window.
The Profiling window will be displayed.
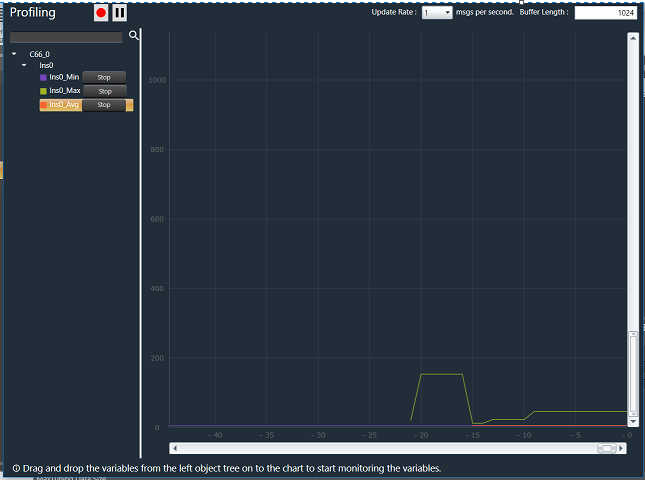
The total number of cores and their corresponding xaf instances are displayed on the left side in the object tree. Each xaf instance has 3 additional variables i.e., Min, Max and Avg. Any variable can be dragged and dropped on to the graph to start CPU profiling for that instance. A “Stop” option will be displayed next to the variable, which is already started. Active streams can be matched with the curve on graph by the colors of the curve and the rectangular block next to the state variable.
There is a possibility to zoom x and y axes.
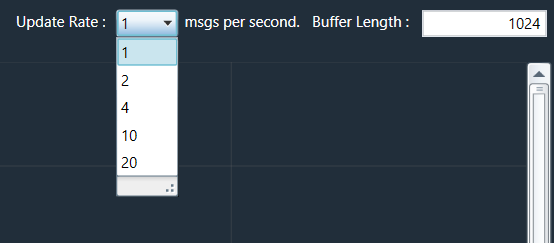
The update rate can be set to any of the five values available(i.e., 1,2,4,10,20). This rate will be applied to all live streams. Buffer length (The maximum stream data that can be stored) can be changed any time during profiling.
The user is allowed to open multiple profiling windows for a device.