Within the impulse response viewer is possible to modify some parameters to improve the presentation of the IR and the relative transfer function. Click on the settings icon of the relative chart.
For the Impulse response, it is possible to cut the IR and window it.
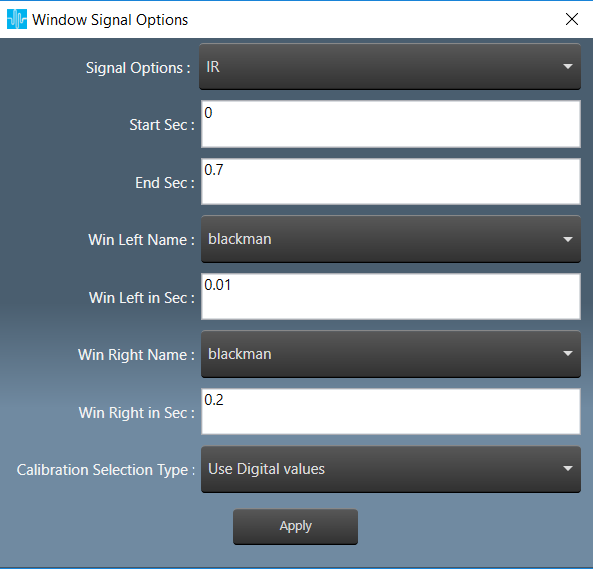
- start, in seconds. The start cut of the IR
- end, in seconds. The end cut of the IR
- Win Left Name, the window applied to the left side of the cut (see image below)
- Win Left in Sec, the length of the left side window in seconds
- Win Right Name, the window applied to the right side of the cut
- Win Right in Sec, the length of the right side window in seconds

- Calibration Selection type
For IR three types of calibration, accordingly to hats manual, p.39
- Digital Values: the compensation constant are not considered, the results and the units are in a.u. (arbitrary unit)
HATS equivalent Transfer Function v/v (small v doesn’t stand for volt!).
In MM this is called arbitrary unit a.u. and it is displayed as dBFS - Arbitrary OUTPUT calibration (output calibration not yet implemented in GTT) as a workaround for proper Units in Transfer Function (H(f)) (0dBFS → 1Vpk)
HATS equivalent, Normalized Sound Pressure Level Pa/V - Calibration (removed stimulus), (Hpa(f)) to have a PASCAL outcome, independent from the generator
HATS equivalent, Sound Pressure Level Pa

- Digital Values: the compensation constant are not considered, the results and the units are in a.u. (arbitrary unit)
The Transfer function options in the Frequency domain allows displaying the IR as transfer function in the complex frequency domain (magnitude+phase). Two methods are implemented:
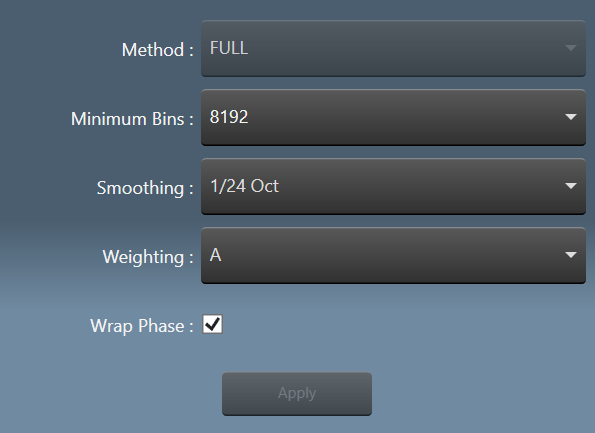
- Method, now is fixed to FULL (welch is deactivated and selected automatically for recordings).
- FULL the power spectrum, or single-sided auto-spectrum, contains the squared RMS amplitudes of the signal. The signal cut and the windows selected in the time domain (see above) is fully transformed and its Power density calculated. There are no options, the frequency array is automatically computed, based on the next power of 2 of the IR length for an FFT, the frequency bins are calculated accordingly. This method also provides the phase of the TF
It is also possible to select the smoothing for spectrum and phase. Pressing apply will update the chart.
- Minimum bins, the minimum number of bins of the FFT. If the signal is larger of minimum bins an FFT zero-padded to the next power of 2 is computed.
- Smoothing of spectrum and phase
- Weighting is used to emphasize or suppress some aspects of a phenomenon compared to others, for measurement
- Wrap phase: if selected, limit the phase in the range -180/180 degree.

- WELCH (DEACTIVATED FOR END USER), computes an estimate of the power spectral density by dividing the data into overlapping segments, computing a modified periodogram for each segment and averaging the periodograms.
This method doesn’t provide the phase of the TF (a zero vector is generated instead)
P. Welch, “The use of the fast Fourier transform for the estimation of power spectra: A method based on time averaging over short, modified periodograms”, IEEE Trans. Audio Electroacoust. vol. 15, pp. 70-73, 1967.

- BINS per segment, number of points used to calculate the FFT of every segment in WELCH
Segment Overlap, Percent of Bins per segment to overlap between segments - Segment Window, the window used for conditioning every segment
With the viewer it is possible to inspect and analyze the recording as well
- select Recorded as signal type, length and windowing works as usual but are applied to the recording

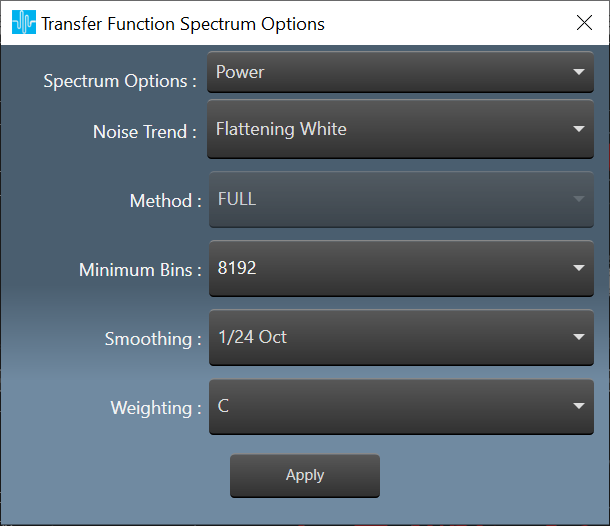
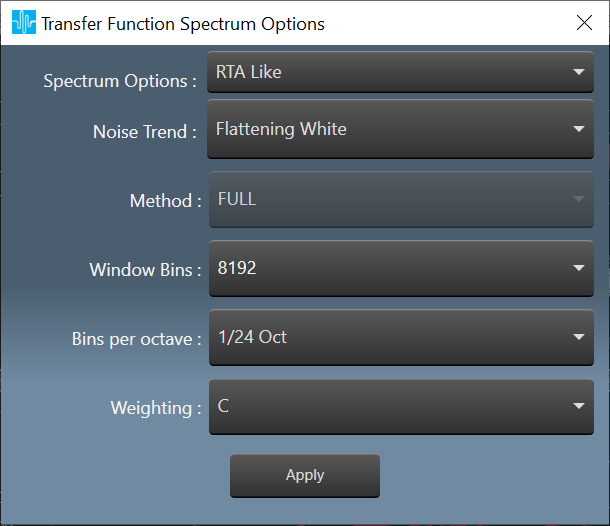
- Two possible spectrum processings are available for recorded signals
-
- The Usual Power Spectrum
- A Constant Q transform based on librosa
-
- Both can change the slope of pink noise (detrend)

- WHITE FLAT (default, the power spectrum shows white noise as flat)

- PINK FLAT compensates the -3dB/oct behavior of ordinary pink noise (the same noise is detrended in the image). The power of the two spectrums is preserved.

- Available Calibrations are:

- Digital Values: the compensation constant are not considered, the results and the units are in a.u. (arbitrary unit)
In MM this is called arbitrary unit a.u. and it is displayed as dBFS - Calibration Sound Pressure of the recording in Pa