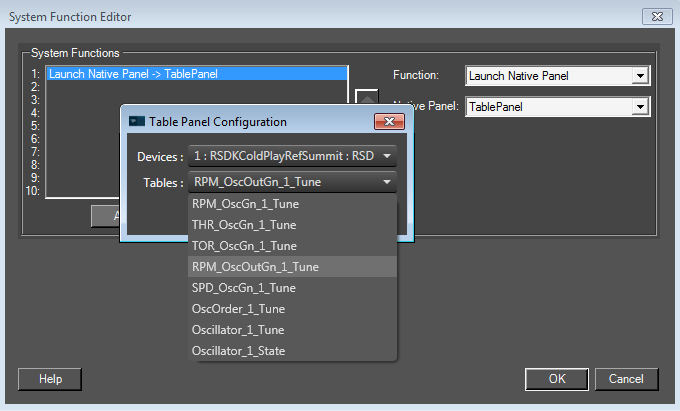
User can change mode in SFD in audio object properties tab and can choose between two modes LUT 2D and LUT Index.
LUT 2D Mode
This is the default mode.
LUT Index Mode
This is an additional mode used for indexed tables. With this mode there is one more parameter related, called
LUT Depth which describes the number of tables that will be indexed (the object is basically a one-dimensional array of LUTs).
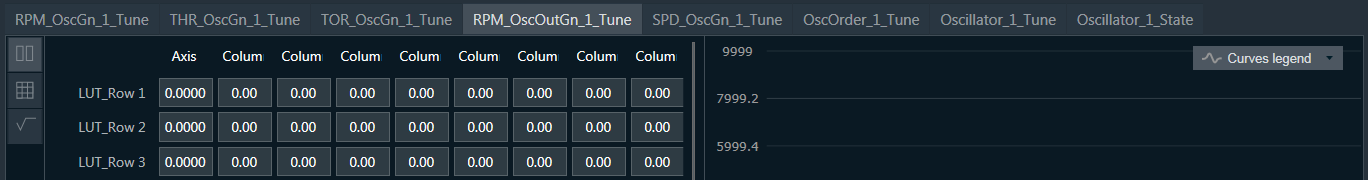
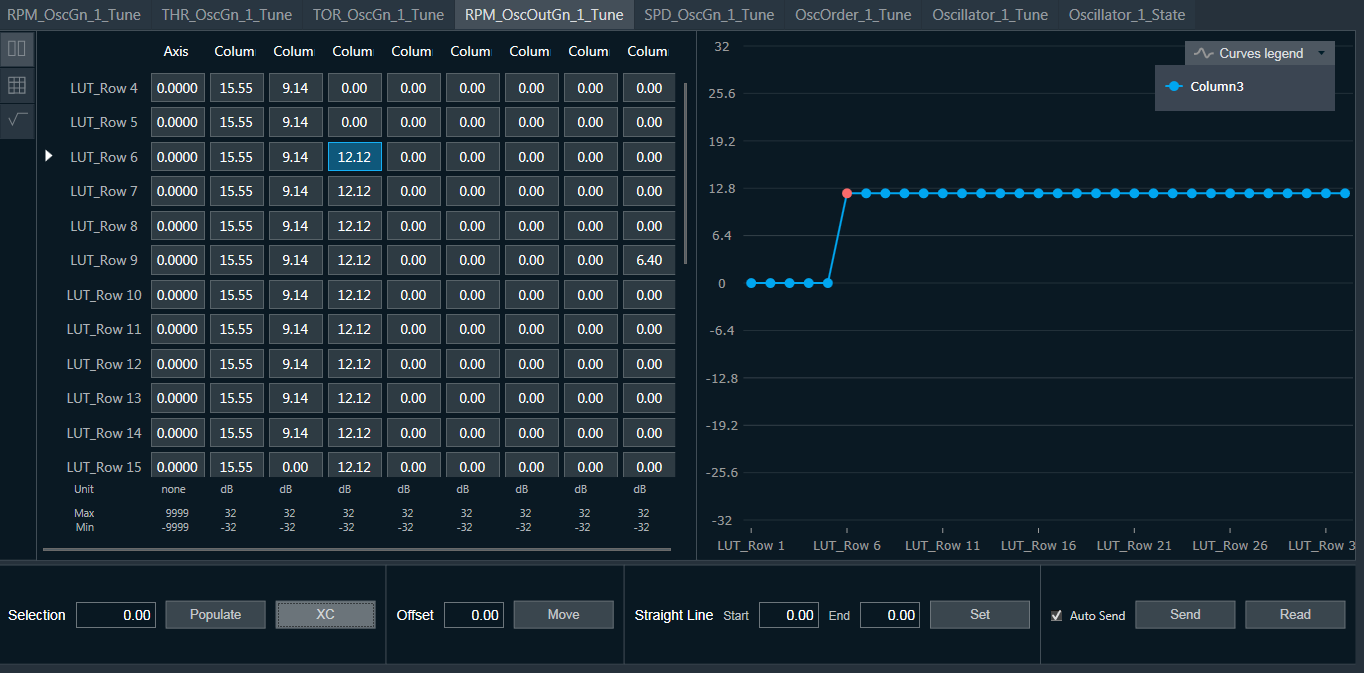
Following figure is showing the look up table window in LUT Index mode with LUT Depth set to 3.
Tunable Parameters
| Name | Type | Description |
| Gain | Numeric | |
| Axis | Numeric |
Functions
Grouping
Use the “Group” parameter to assign the table to a group. Tables with the same group name will show in the same window. The group name is displayed in the upper left corner of the window.
If you do not want to use grouping, leave the group name blank.
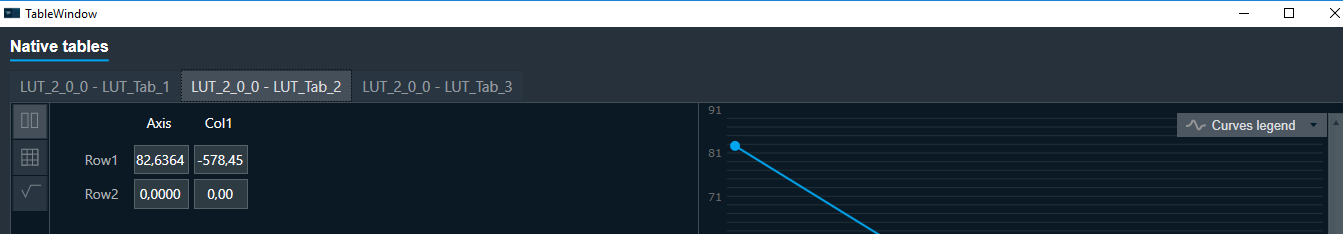
Switching to another table
User can switch between tables using a tab control with table names on the top of the control.
Default tab is the table that was chosen when adding native panel launch trigger.
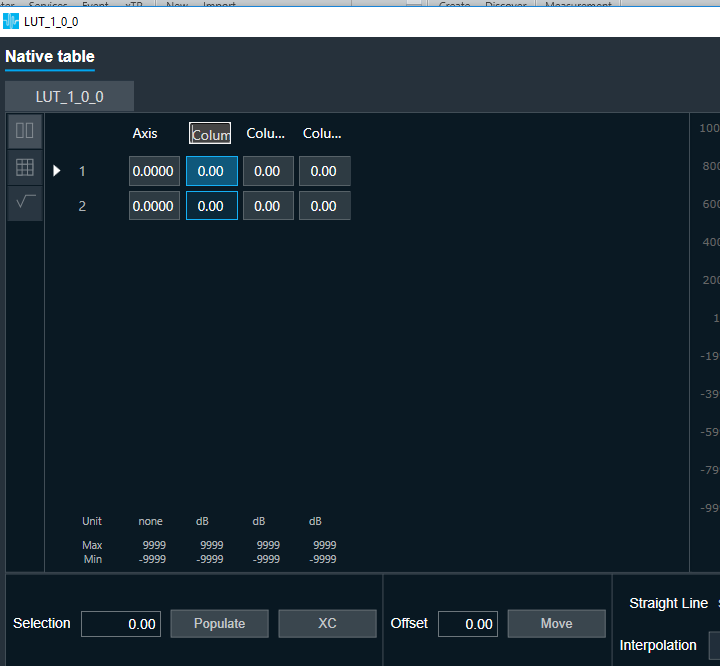
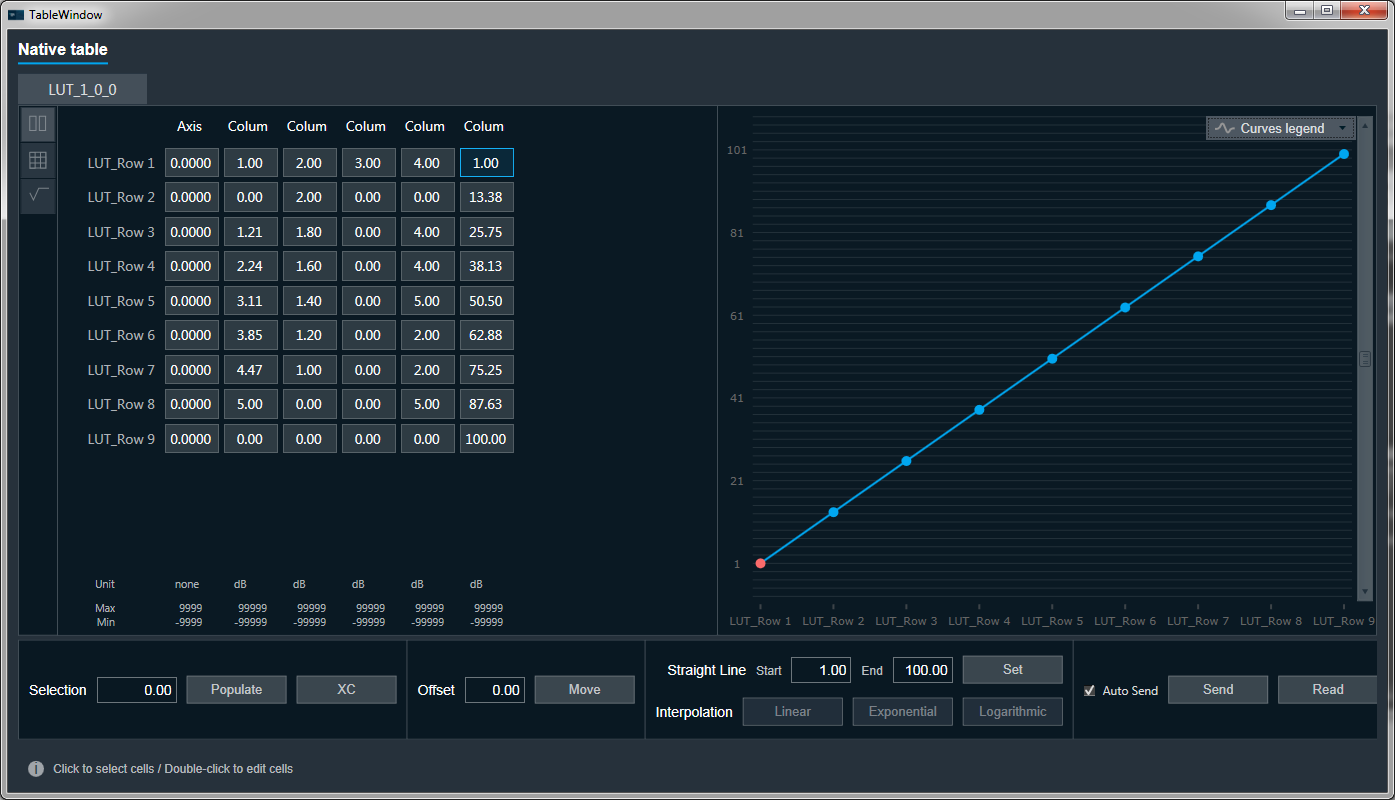
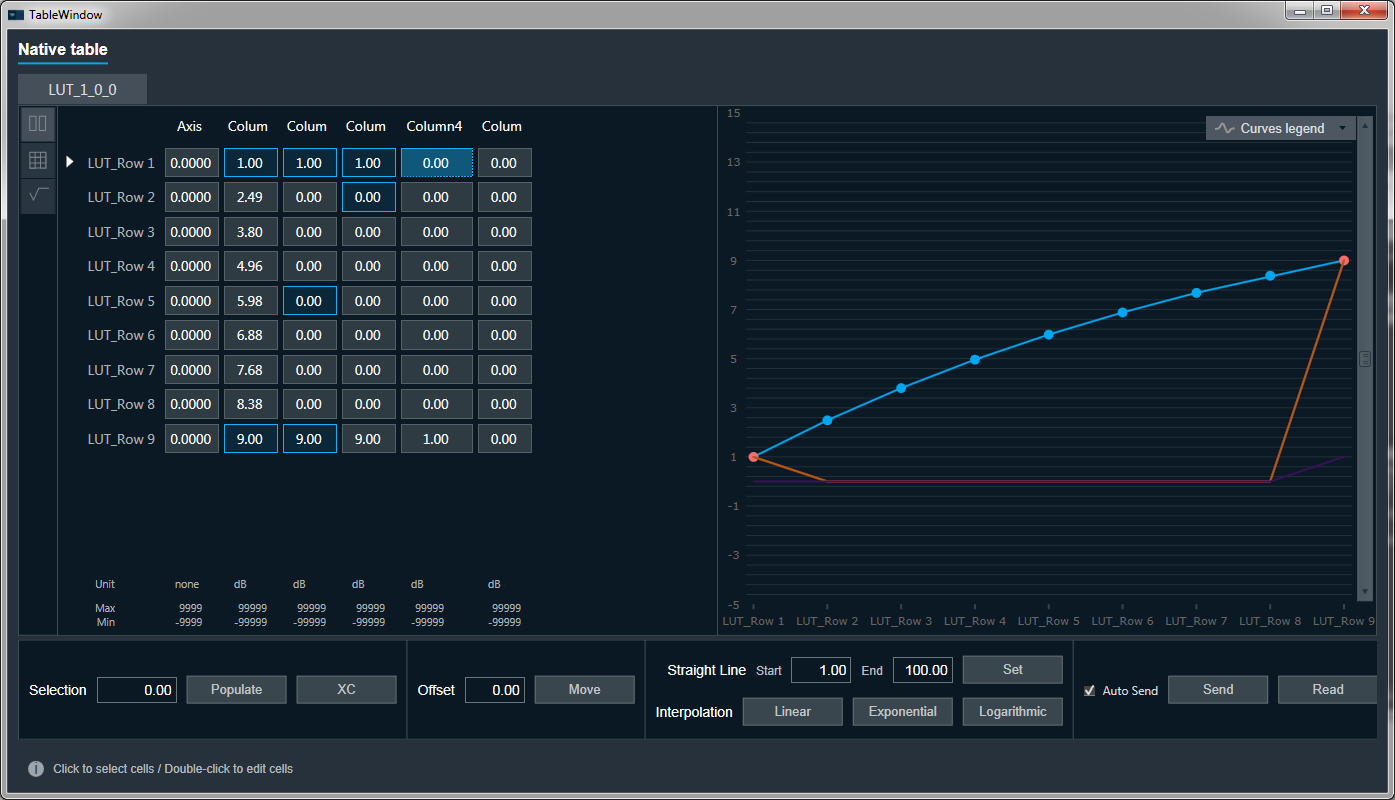
Changing view
Native table control has three type of views (Table and Chart, Table Only, Chart Only), which can be change by buttons in top left corner.
![]()
select first button to activate table and chart view
Table and chart are visible
select second button to activate table only view
Only the table is visible
select third button to activate chart only view
Only the chart is visible
Selecting cells and points
When selecting multiple data series (multiple columns), only one series (selected first) will be editable, others are used as a reference and cannot be edited from the chart without changing the data series selection.
Selecting column
There is a possibility to selecting all column by clicking on column label.
Selecting multiple cells/points
There are several methods to select several cells/points at once. Most of them both work on table as well as on chart.
Ctrl + click on point (chart) or cell (table) adds clicked element to the overall selection.
Ctrl + click on marked point or cell will deselect it
Shift + click to select a range of values between previously selected and clicked element
You also can click and drag multiple points
Ctrl + A to select all cells
Editing single value
To edit cell’s value, select the cell and type in desired value.
the corresponding cell element will be highlighted and editable
Each point on chart is corresponding to one cell. You can grab it and drag up or down and value will be updated accordingly.
Editing Column and Row labels
The Column and Row label can be edited by double clicking on the Row/ Column header
By default label of Columns will start from Column1 and for Rows it starts from 1
Setting same value to all selected cells
In case you would like to populate all selected cells with one value please use upper tool box.
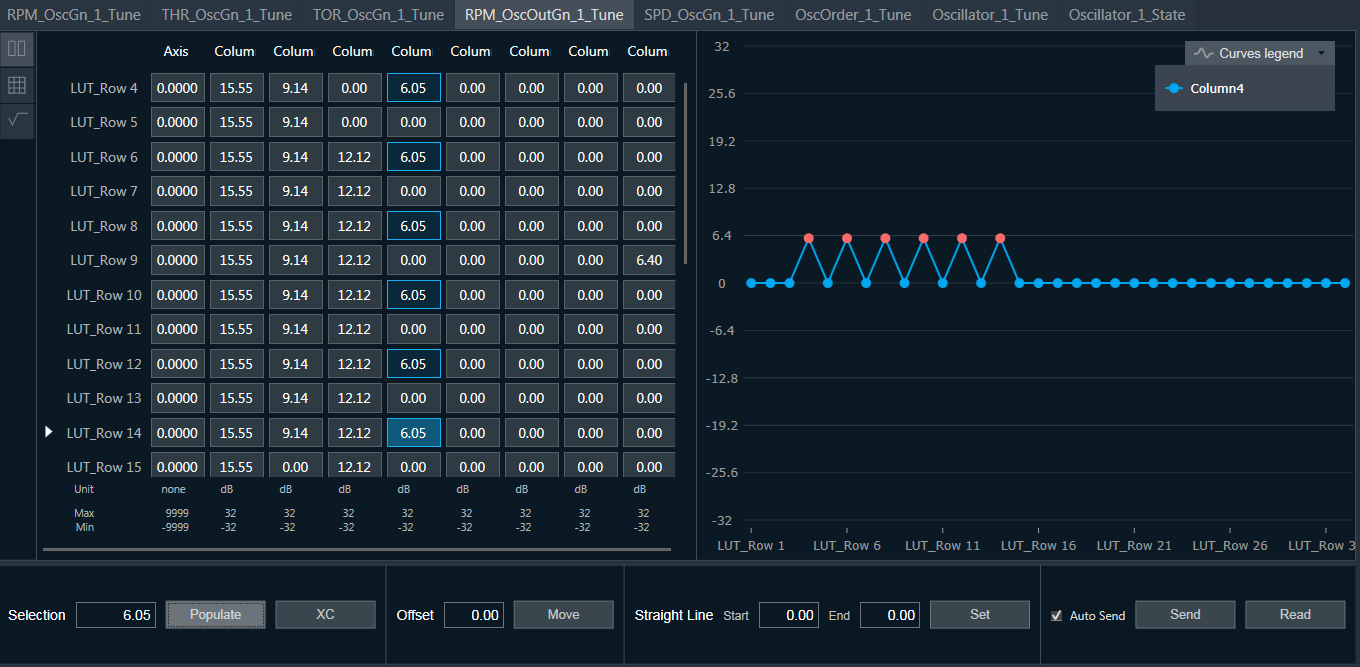
Select cells you want to change
Type in new value in tool box
Click populate
all selected cells should change their value to the value of the tool box
Cross copy
To change all values below a certain cell, or all values on a chart to the right of the selected point, use the Cross copy function (XC).
Set the value in one cell
Click XC button
all values below the selected cell should change value to the value of the selected cell in the current column.
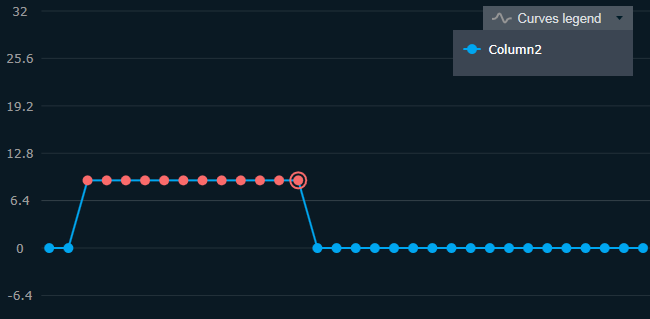
Changing value of selected cells
Select the desired cells
grab one of the selected points on the chart and drag it up or down
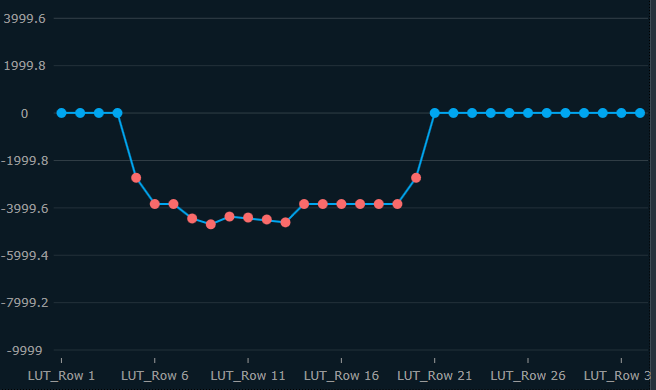
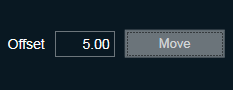
Offsetting value
Select the desired column
type in the offset value in the offset toolbox
click move
all values of the current column should change their value by the given offset value
Setting up values in straight line
It is possible to initialize the values in a straight line using linear interpolation between first and last cell/point of the selected data series (column).
Provide a starting and ending value
click Set
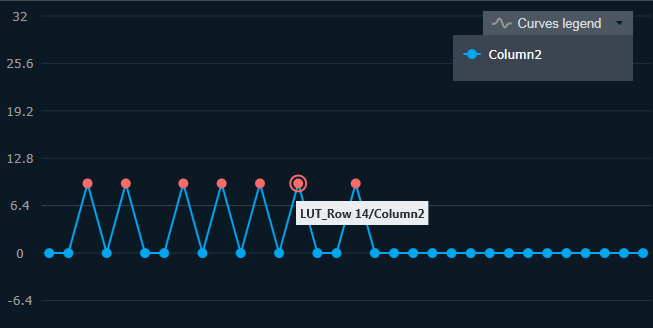
Interpolation
To enable interpolation you need to select exactly 2 cells that are not adjacent in one column and that have start and end values already set.
click desired interpolation type
- Column 1 was interpolated exponentially
- Column 2 was not interpolated as there are more than 2 cells selected
- Column 3 was not interpolated as selected column are adjacent
- Column 4 was not interpolated as there is only one cell selected
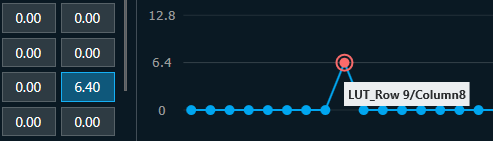
Copy from
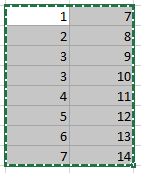
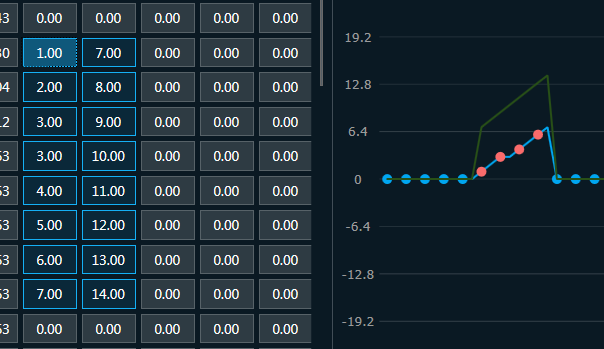
It is possible to copy data from different tool e.g. from MS Excel.
Select a cell in MS Excel and click Ctrl + C
Go to the native table and select the cell which should be the first copied cell
Data will be copied accordingly like in screens below.
Data sending and reading

Sending data
Due to a large amounts of data tuned in the tuning tables, Live tuning can be disabled. When live tuning is disabled, it’s possible to use the Send button which sends all of the table panel data at once.
Reading data
Using Read button we can initiate reading all data from amplifier.