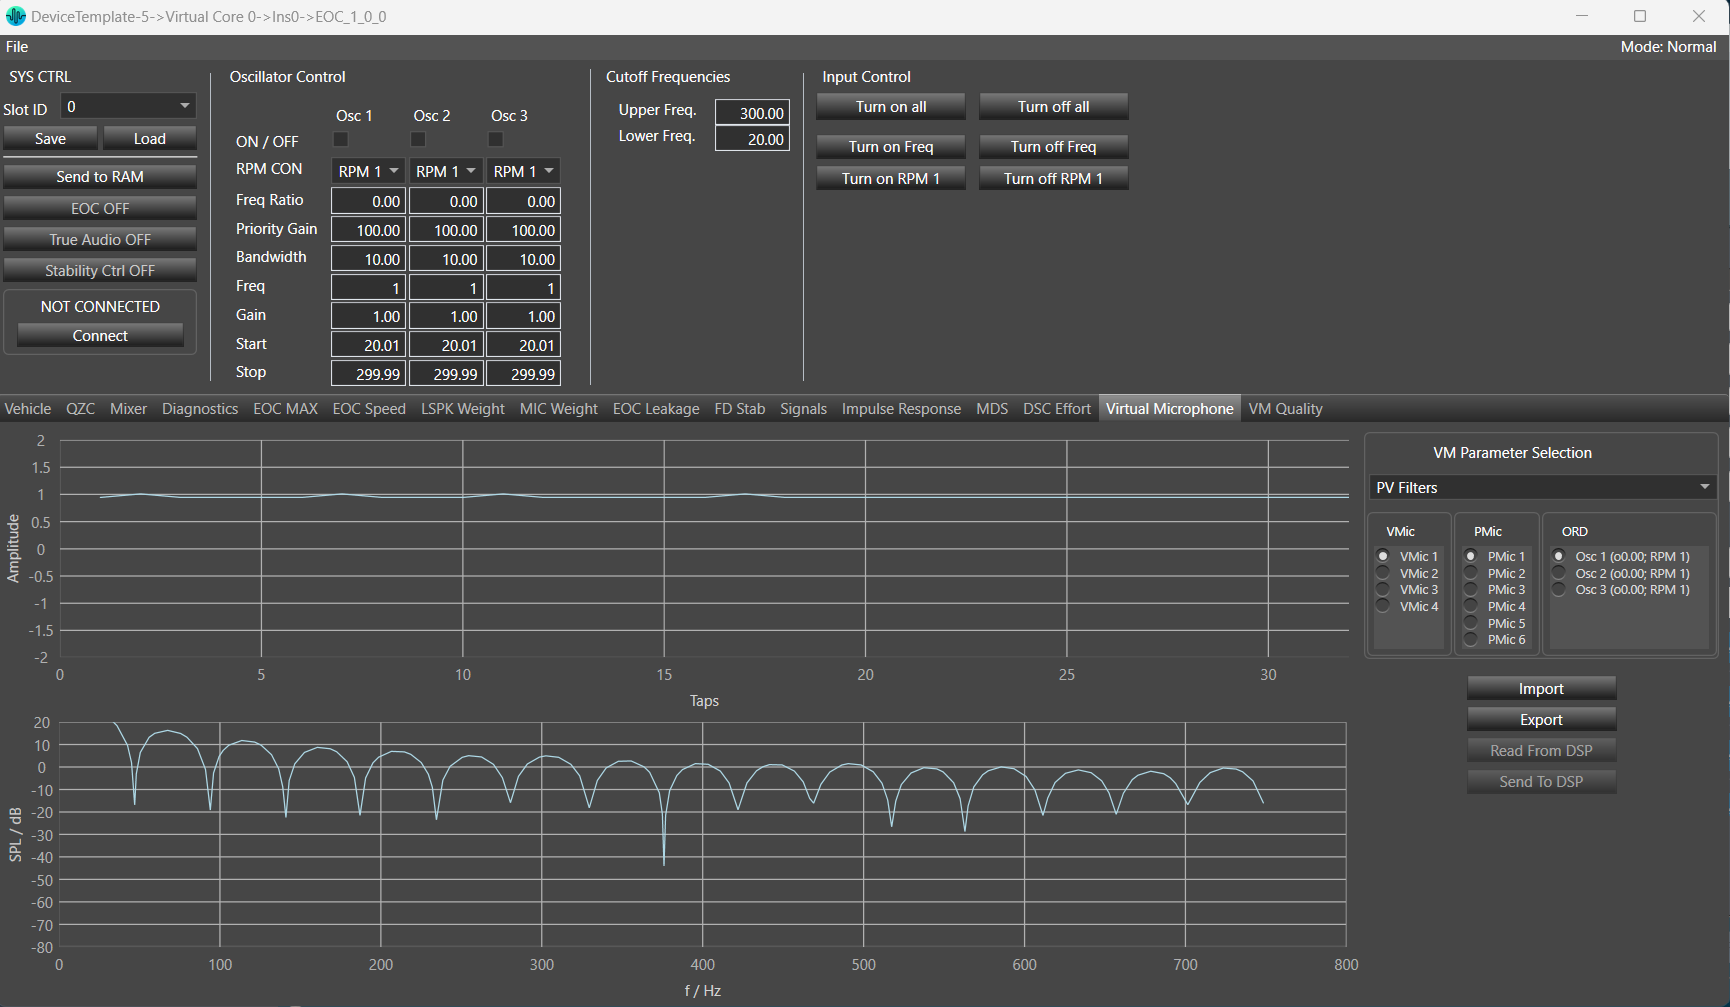
You can monitor and tune the parameters of the Virtual Microphone such as PV filters, remote weights, and virtual weights. Options to send, receive, import, and export are available in this tab. You can monitor any parameters from the Virtual Microphone parameter in the graph.
This tab also includes the amplitude and frequency response graphs. You can choose any of the three options: VMic, PMic, or ORD.
This tab in EOC panel will be only visible when Virtual Mic is enabled from additional parameter section.
By default PV Filters from VM Parameter Selection , VMic 1 from VMic , PMic 1 from PMic and Osc 1 from ORD will be selected on panel launched.
VM Parameter Selection: You can select any option out of PV filters, Remote Weights and Virtual Weights.
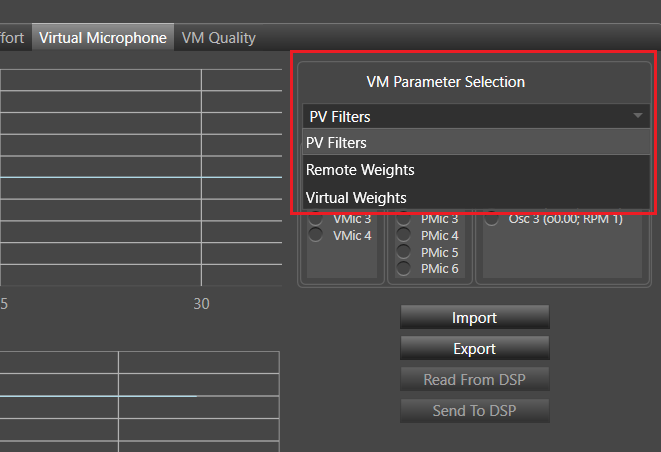
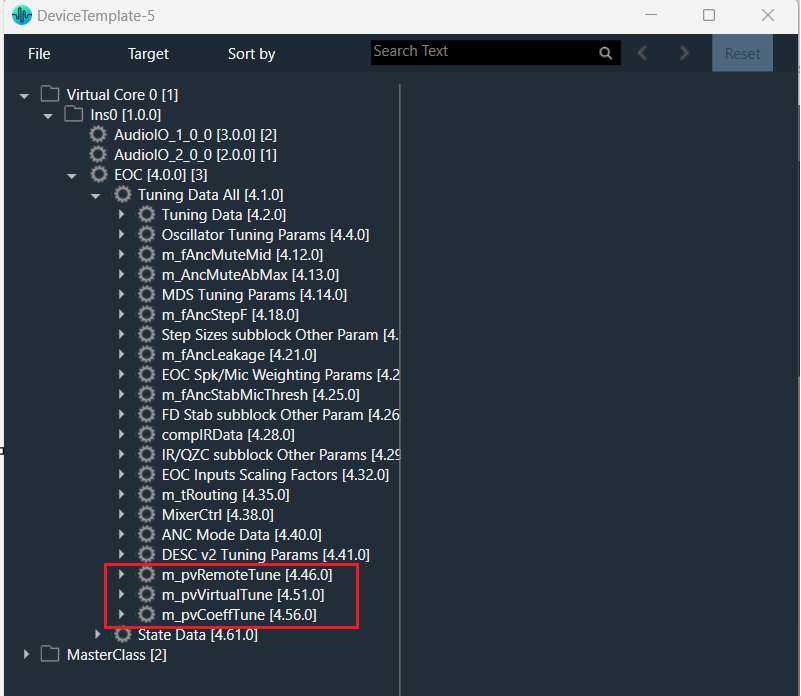
These three parameters are mapped with state variables given in state variable tree.
- PV filters mapped with “m_pvCoeffTune”.
- Remote Weights mapped with “m_pvRemoteTune”.
- Virtual Weights mapped with “m_pvVirtualTune”.
- Changing any value in “m_pvCoeffTune”, will reflect in graph on the selection of PV Filters.
- Changing any value in “m_pvRemoteTune”, will reflect in graph on the selection of Remote Weights.
- Changing any value in “m_pvVirtualTune” , will reflect in graph on the selection of Virtual Weights.
VMic: This is virtual mics. You can select any option from given virtual mics. The number of VMic depend upon ‘Number Of Virtual Mics’ parameter from additional parameter section. Minimum number of VMic is 1 and maximum number of VMic is 8.
Number of VMic = ‘Number Of Virtual Mics’ = 4 (example)

PMic: This is physical mics. You can select any option from given physical mics. The number of PMic depend upon ‘Virtual Mic Enable’ , ‘Number Of Virtual Mics’ parameter from additional parameter section and ‘# of Mics’ (m_NumElements) from audio object property section.
Virtual Mic Enable: Min =0(disable), Max =1(enable)
Number Of Virtual Mics: Min =1, Max =8
Set value of ‘Virtual Mic Enable’ to 1 and ‘Number Of Virtual Mics’ =4 and ‘# of Mics’ (m_NumElements) = 10
The number of physical mics PMic = 10 – 4

ORD: This is order and depends upon ‘Num Order’ from EOC additional parameter section. Minimum number of order is 1 and maximum is 8.
Number of order = ‘Num Order’ = 3(example)

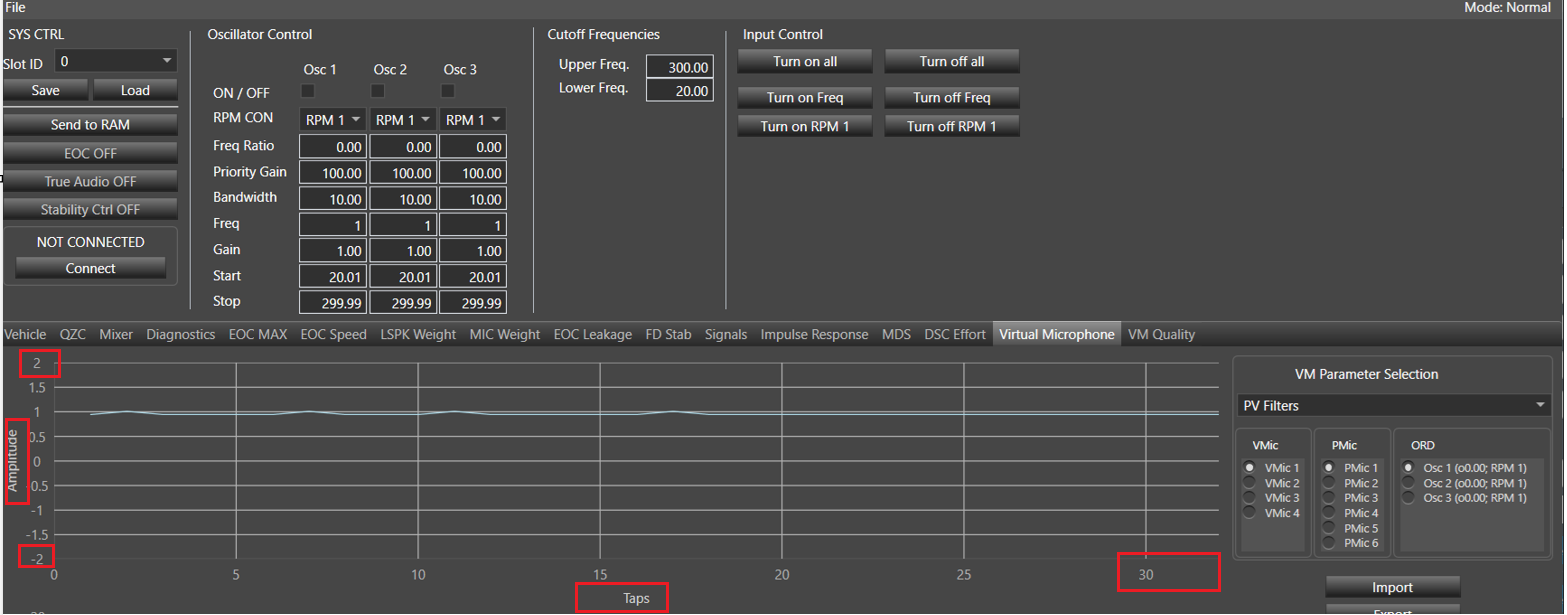
Time Domain Graph: This graph will display the actual value of the state variables as per selected VMIc, PMIC, and ORD.
PV filters is selected-
- Y axis title is Amplitude.
- Y axis min and max range will be as per value given in state variable min and max (example if maximum value for any given state variable Order 1. Coefficient 0 [0] is 50 and minimum value for any given state variable Order 2. Coefficient 3 [3] is -50 then Y axis min range will -50 and max range will be 50) . If the given state variable value is less than 10 then max range will be equals to the given sv value +1 and min range will be – (sv value +1). If the given state variable value is greater than 10 then max range will be equals to the given (sv value %10 +1)*10 and min range will be – (max range).
- X axis title will be Taps and range will be from 1 to VM- length of PV Filters(example 32).
VM- length of PV Filters: Min =32, Max =128
In below screen shot maximum sv value is given 0.878243 so max range = 1(ceiling value) +1 = 2 and min range will be -2.
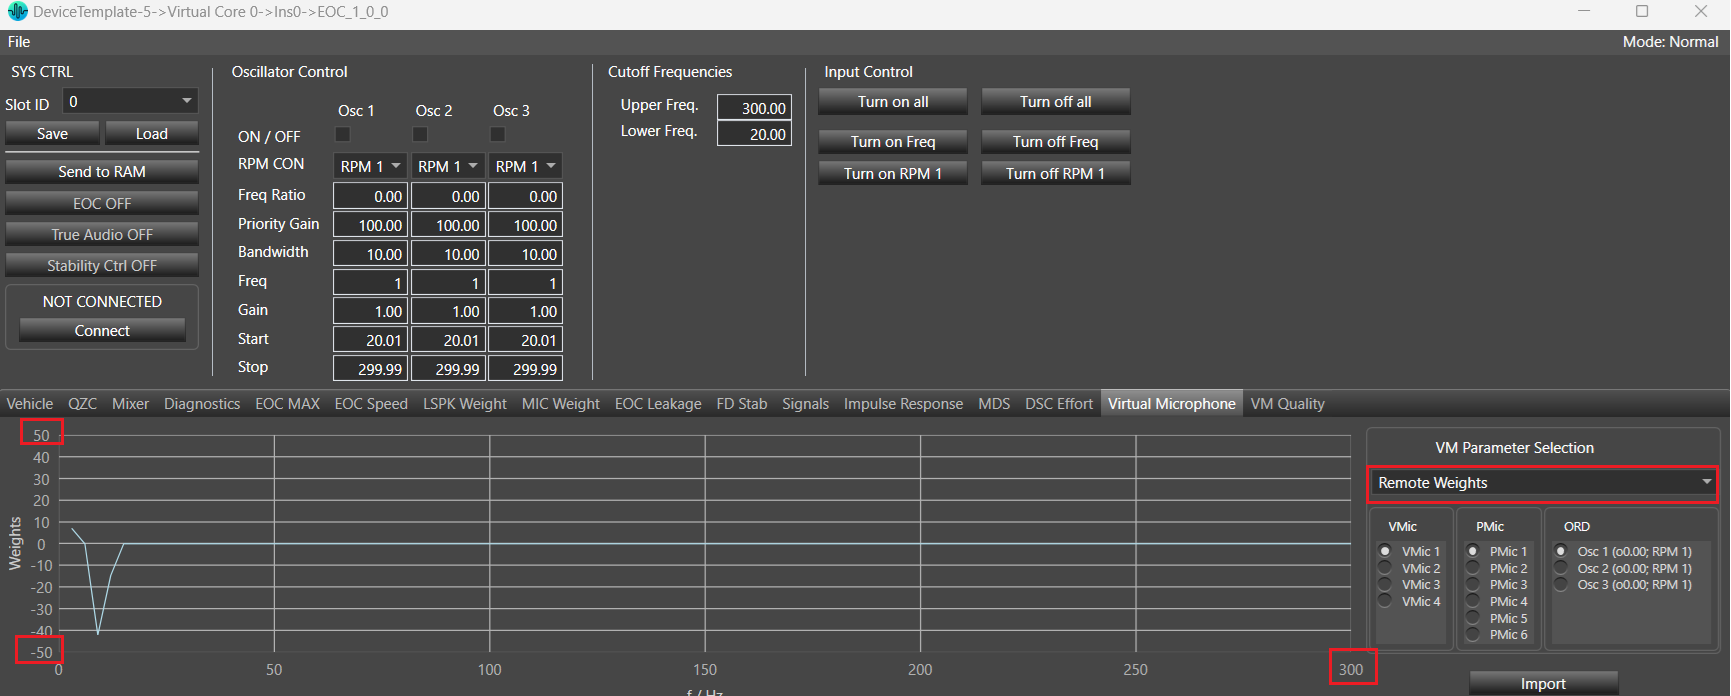
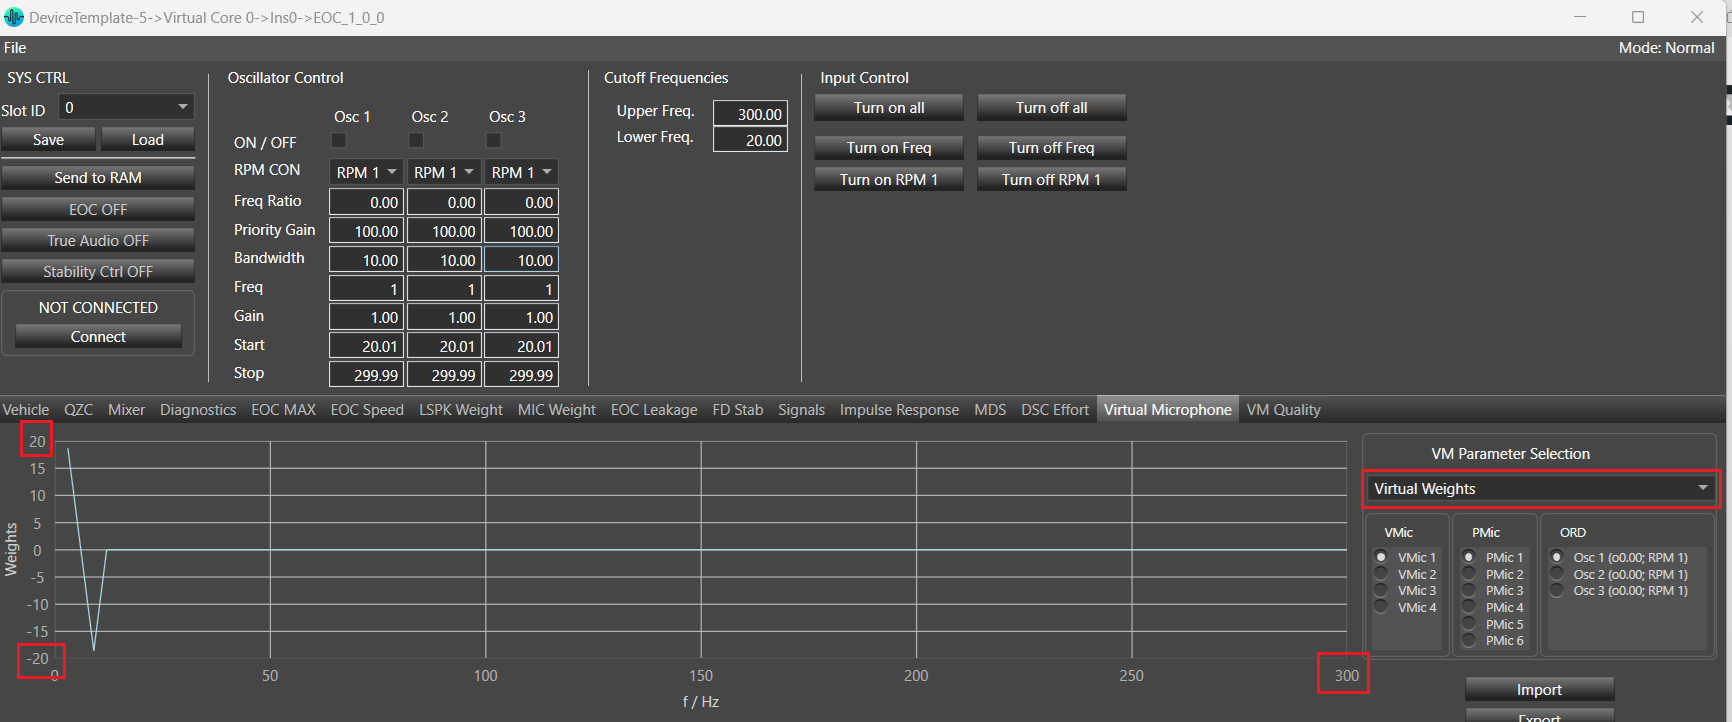
Remote Weights/ Virtual Weights selected.
- Y axis title will be Weights.
- Y axis min and max range will be as per value given in state variable min and max (example if maximum value for any given state variable Order 1. Coefficient 0 [0] is 50 and minimum value for any given state variable Order 2. Coefficient 3 [3] is -50 then Y axis min range will -50 and max range will be 50).
- X axis title will be f/Hz and min range will be 3 and max range will be equal to the value of VM-length of Remote and Virtual Weights =100 example)*3.
VM-length of Remote and Virtual Weights: Min =100, Max =400
Frequency Response Graph: Frequency response gets calculated with given amplitude values.

Frequency Response Graph is available only for PV Filters.
Export: This is used to export all the state variable’s (m_pvRemoteTune, m_pvVirtualTune and m_pvCoeffTune irrespective of selected VM parameter) value to the excel sheet in specific format.
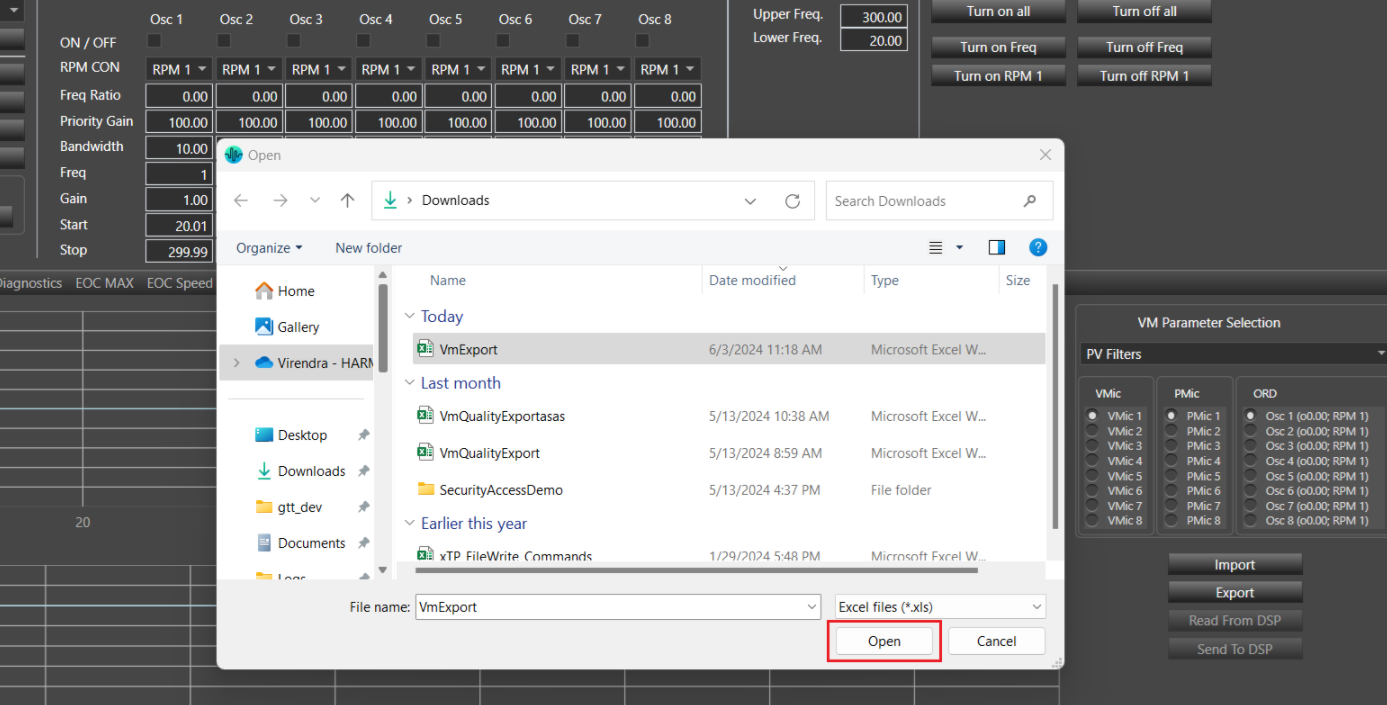
Steps to Export:
- Click on Export button.
- Browse folder window will be displayed.
- Provide filename and click on Save.
By default file name will be “VmExport”.

Below is exported file format:
- 3 Valid Sheets
- pvFilterCoeffRead corresponds to State variable m_pvCoeffTune.
- pvRemoteWeightRead corresponds to State variable m_pvRemoteTune.
- pvVirtualWeightRead corresponds to State variable m_pvVirtualTune.
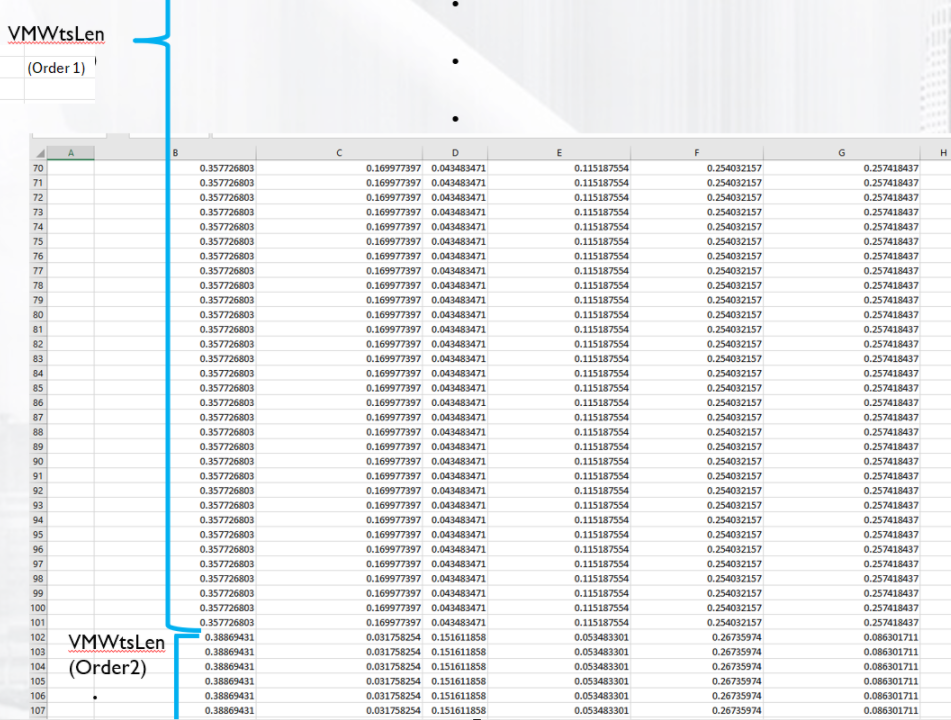
2. Data Layout
- Column A in each of the 3 sheet is empty.
- Data starts in column B.
- Column ordering is VirMic1PhyMic1, VirMic1PhyMic2, VirMic1PhyMic3.
VirMic2PhyMic1, VirMic2PhyMic2, VirMic2PhyMic3
(assume m_PhyMicNum=3 , m_VirMicNum = 2, VM- length of PV Filters =32, Num.Order=4 and VM-length of Remote and Virtual Weights =100 )
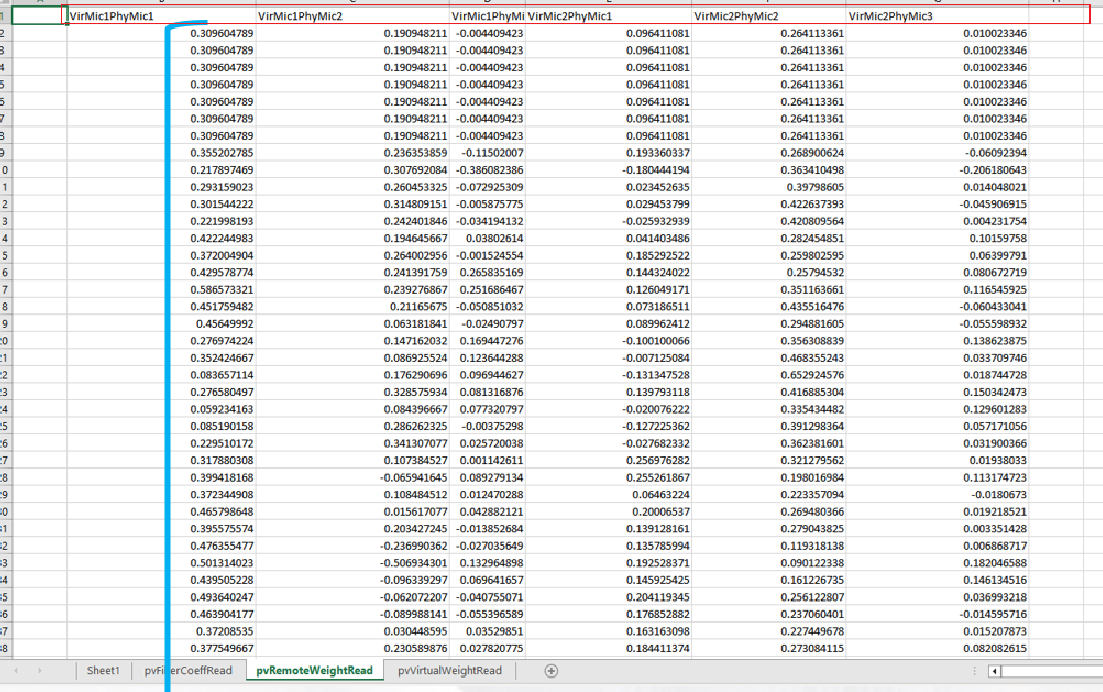
- pvFiltersCoeffRead sheet
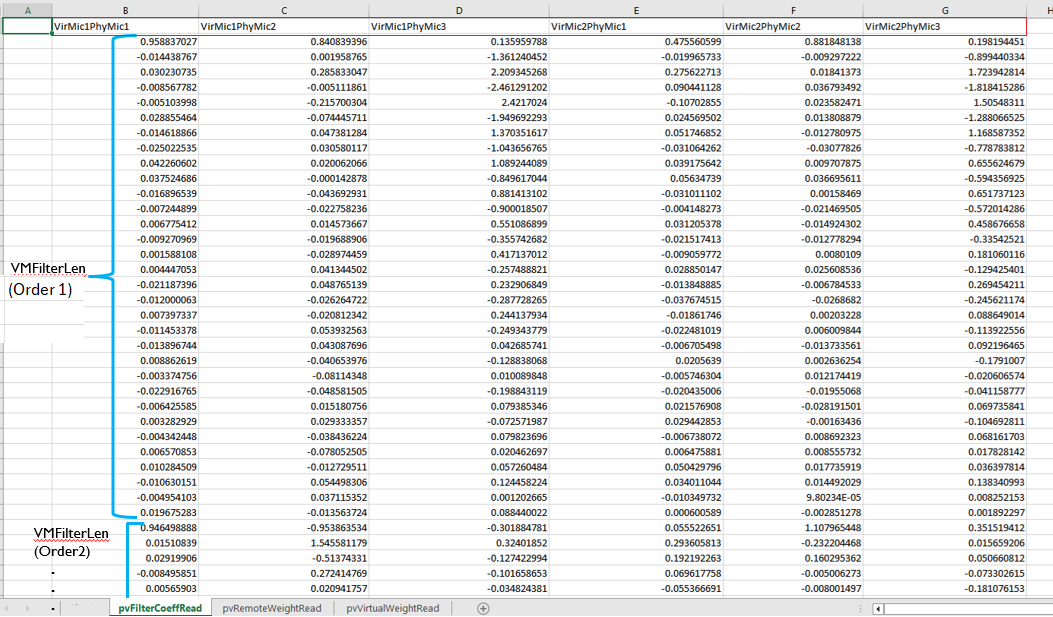
- pvRemoteWeightRead and pvVirtualWeightRead sheets will look like as per below screen shot.
Import: This is used to import all values from excel sheets (pvFiltersCoeffRead, pvRemoteWeightRead and pvVirtualWeightRead) and update the graph and respective state variable’s (m_pvRemoteTune, m_pvVirtualTune and m_pvCoeffTune ) value .
Step to Import:
- Click on Import
- Browse the file location path
- Click on Open
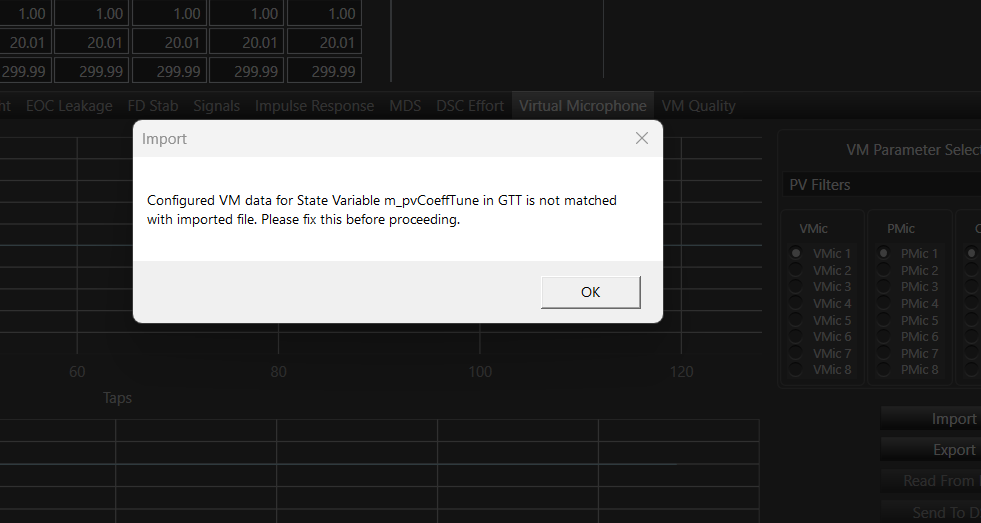
Warning message will be displayed if importing file is not matching with configured parameters (Num.Orders, Num. of Virtual Mics, Number of Physical mics…)
Read From DSP: This is used to read the latest state variable’s value from the device. Once user click on ‘Read From DSP’, It will fetch the latest value and update the state variable (m_pvCoeffTune, m_pvRemoteTune and m_pvVirtualTune) and graph in Panel.
Send To DSP: This is used to send the latest state variable’s (m_pvCoeffTune, m_pvRemoteTune and m_pvVirtualTune) value to the Device.