The ToneControl panel is to tune ToneControl audio object. The state variables of ToneControl audio object can be updated using this panel.
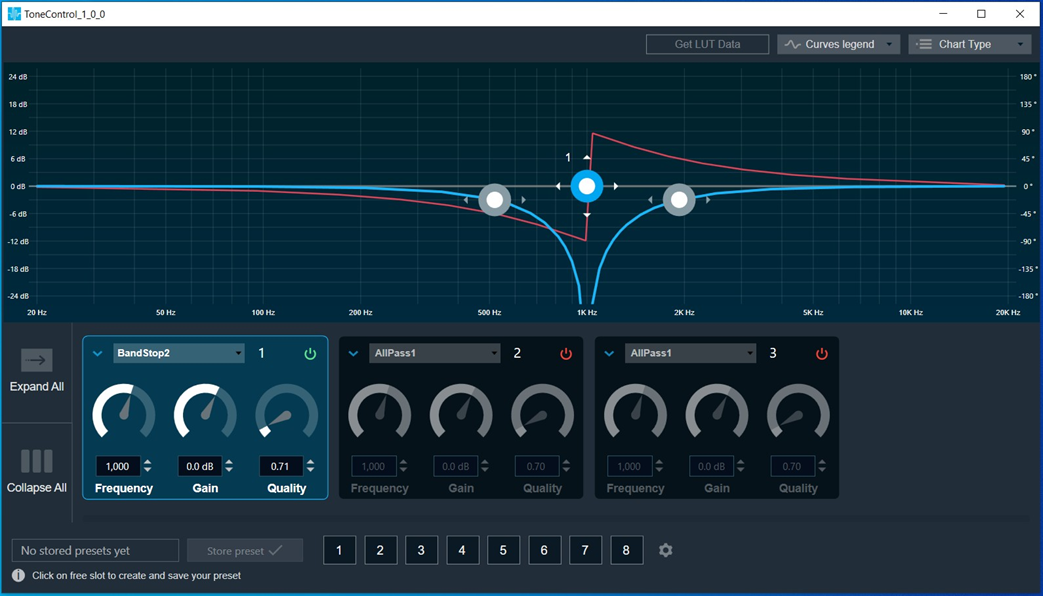
Tone Control Chart
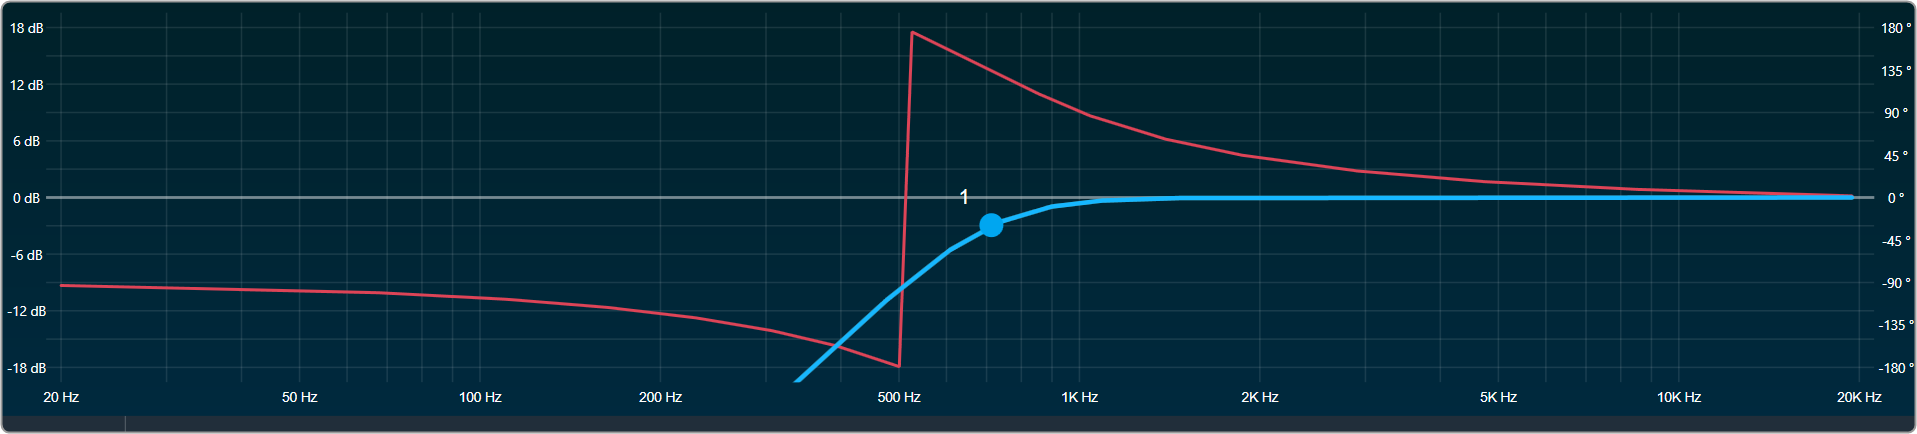
This chart represents the influence of all bands on the frequency and phase response. The left axis shows the amplitude in dB, and the right axis shows the phase in degrees and the X- axis shows the gain.
The number of Biquads are defined with the Signal Flow Designer. The Biquads get dynamically managed inside the GTT. Most of the Biquads are represented by appropriate markers.
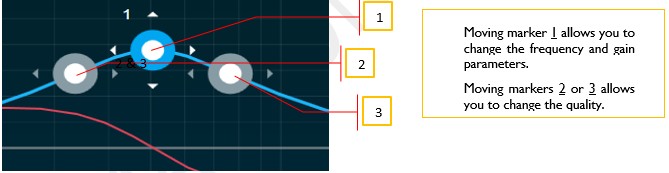
Markers
Markers are movable. Moving them allows you to amend the current Biquad parameters. Each marker corresponds to one or two Biquad parameters. For example, the equalizer shown below has three markers.
Biquad Settings
On the Biquad settings window, you can perform the following operations.
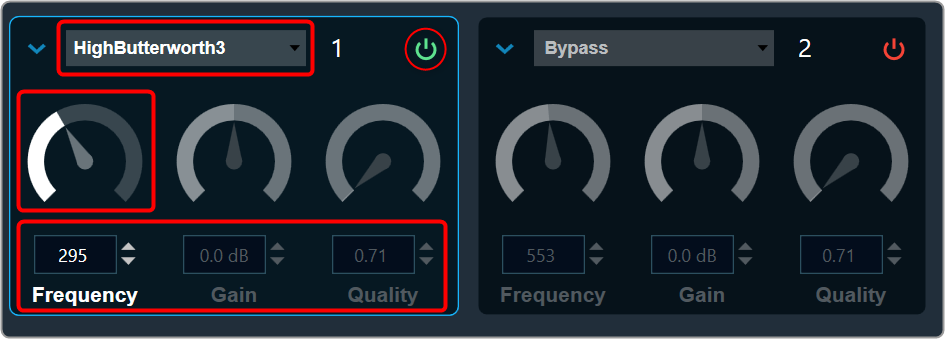
Enabling Bypass
- Click on the
 Bypass button to enable or disable Bypass.
 - In bypassed state, the button is red colored and green colored when biquad is in non-bypassed state.
Biquad is in a bypassed state by default.
Change the Frequency, Gain, and Quality
Frequency: It is used to set the center frequency of each filter.
Gain: It is used to set the center frequency gain of each band of the filter. Not all filter types offer a variable gain.
Quality: It is used to set the width of each band pass or notch type band of the filter. Not all filter types offer a variable quality factor.
- Using the increment and decrement buttons
 you can change the value.
Or - Select the tuner and use mouse scroll to adjust the value
All available filters are added, and default selection is set as All Pass at panel startup.
Biquad Curve Legend
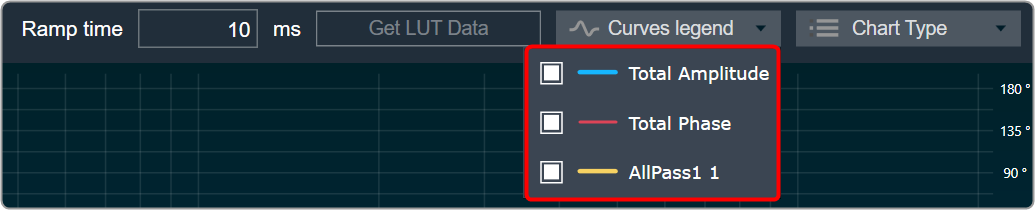
Click on Curve Legend to display all the associated legends. By default, all the curve legends are enabled on the graph. Uncheck the curve to hide it from the graph.
In Tone Control Panel, there is no channel selector since the band values are the same across all the channels.
Biquad Chart Type
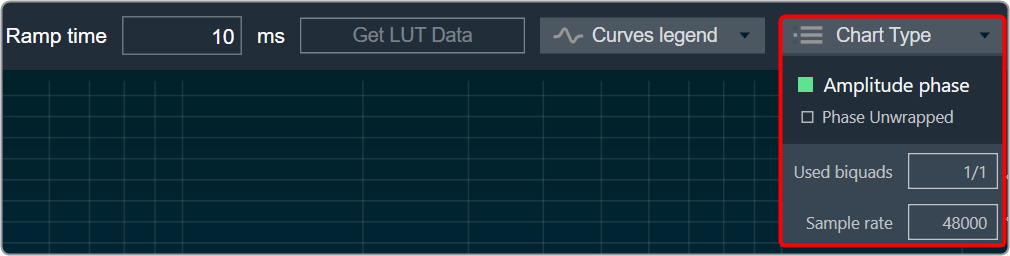
Amplitude phase: It is used to turn on and off appropriate charts.
Phase Unwrapped: It displays absolute values.
- If the phase is wrapped, the display is limited to ± 180 °.
- If the phase exceeds 180 ° or -180 ° it is continued on the other side of the vertical scale.
Used Biquads: This informs you about the available Biquads. The first number is the number of Biquads that have not been bypassed. The second number is the number of available Biquads.
Sample rate: It shows the sample rate at which the filters are operated.
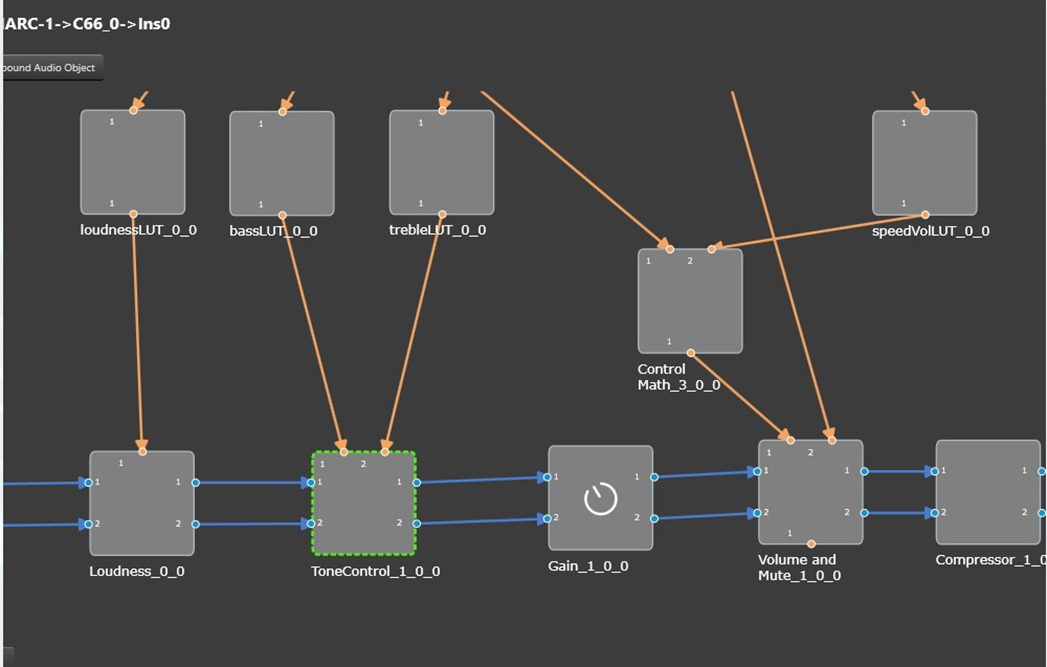
Get LUT Data
When a Tone Control is connected to the LUT objects, the Tone Control Panel can display the graph for the LUT data. These graphs are just for visualization, you cannot alter the graph values from the panel.

- Connect the LUT objects to Control pins of Tone Control object.
- Open LUT panel and set row, column name and values.
- Open Tone Control panel and click “Get LUT data”. This will plot the graph for the LUT data.
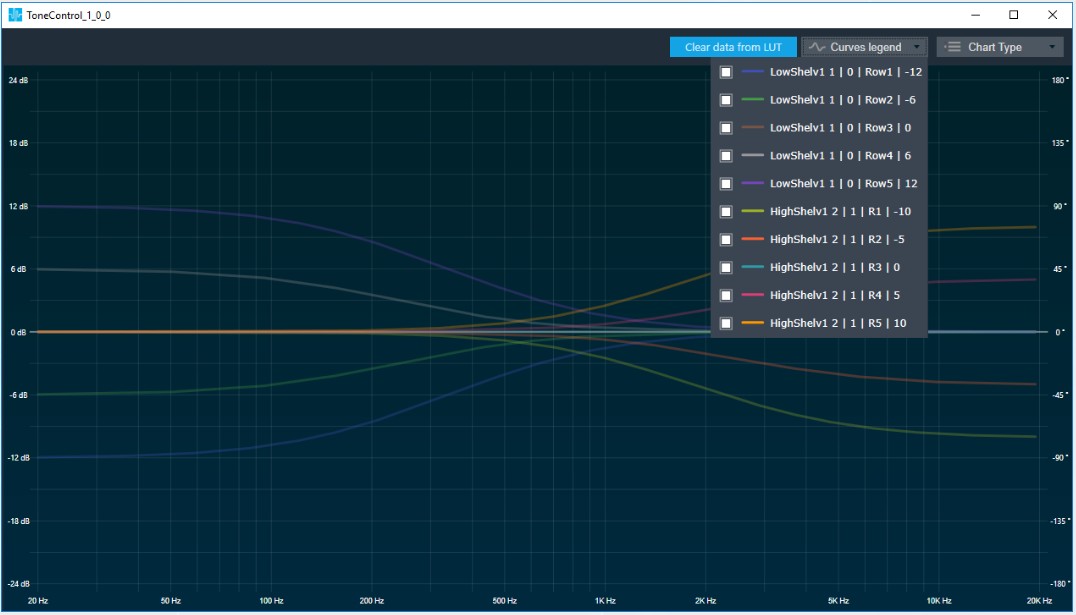
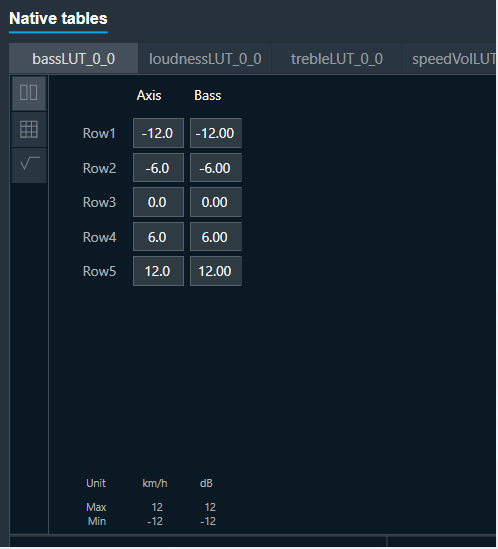
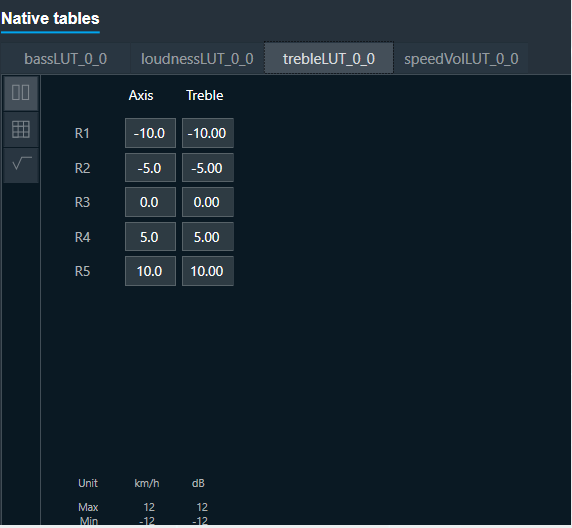
Curve Legend has the following information.
Filter Name | Control Pin Name | Row Name | Gain Value
Ex: Low Shelv 1 | 0 | Row1 | -12
If there is no Control Pin Name given, then the default pin number will be assigned.
“Clear LUT data” will switch back to the previous mode.
“Get LUT data” supports only when it is directly connected to the LUT object.