Cursor Measurement
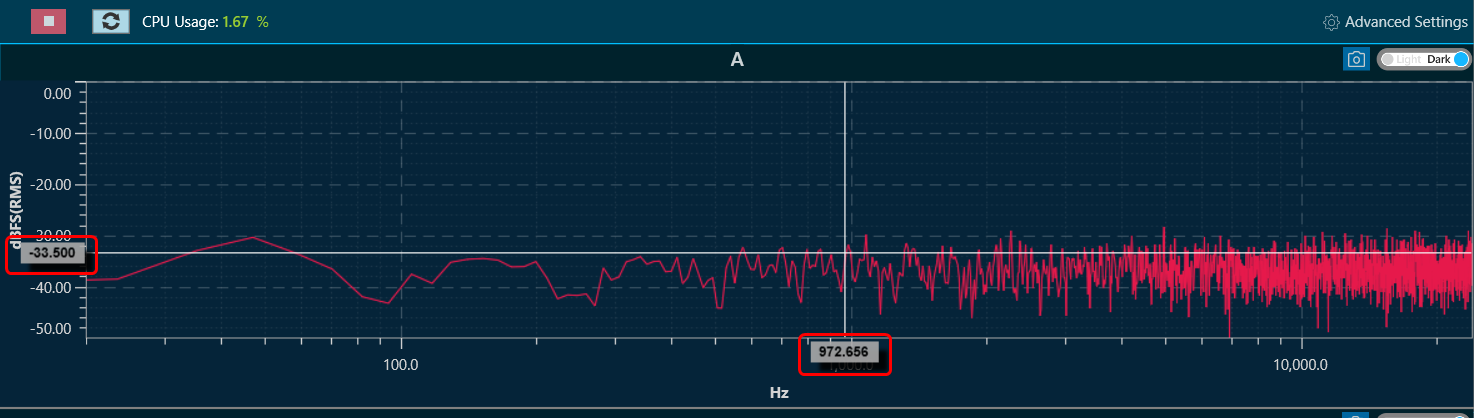
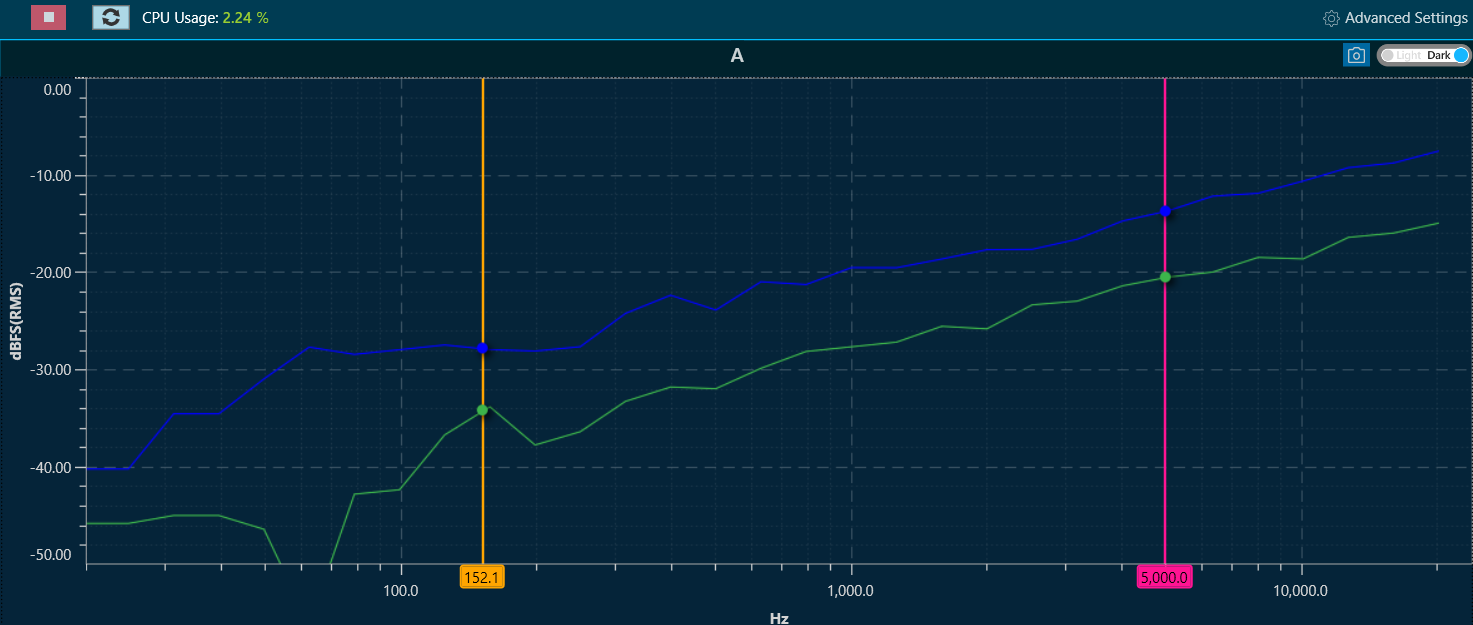
When hovering the mouse over any of the curves or plots on the graph, the horizontal and vertical values of the X and Y positions pointed to will be displayed. It is important to note that while the X value will follow the mouse pointer, the Y value will show the value of the closest trace.
Add Marker
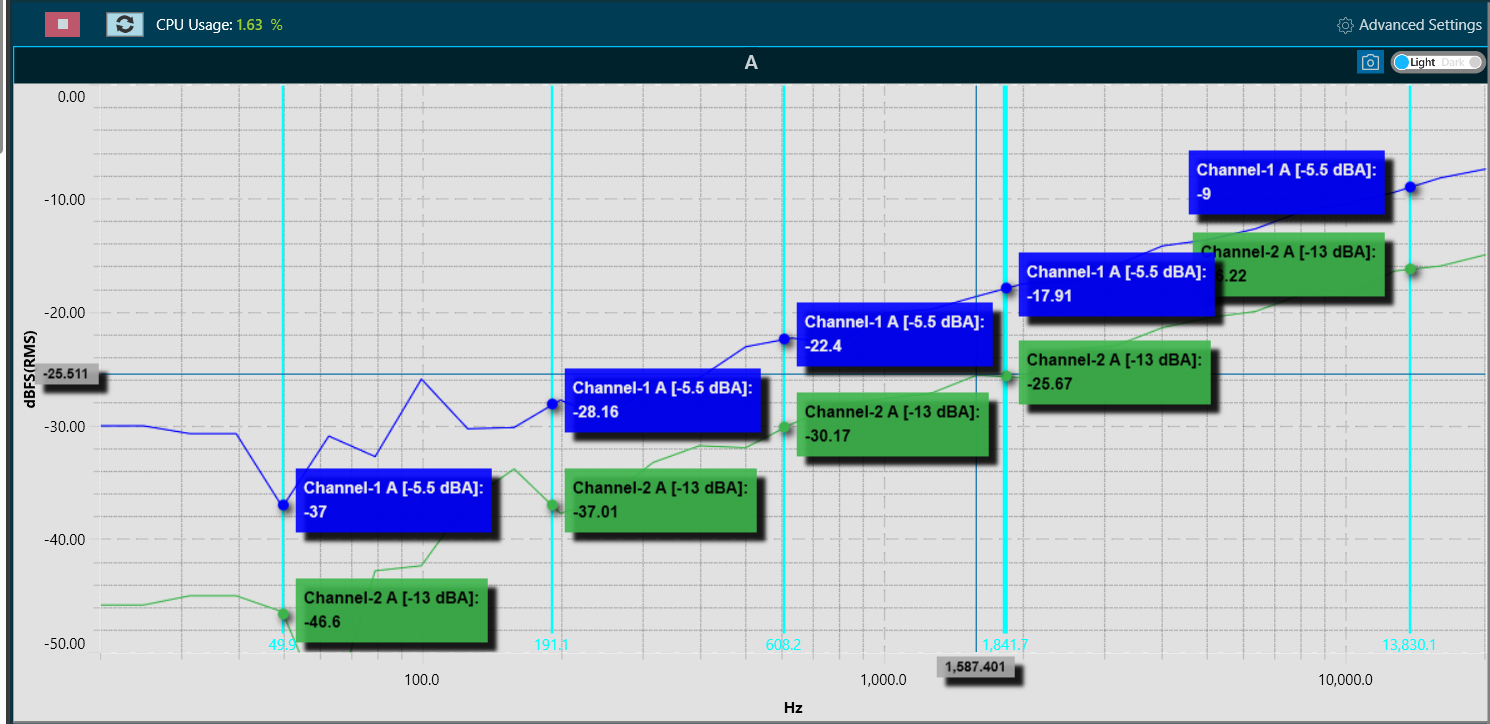
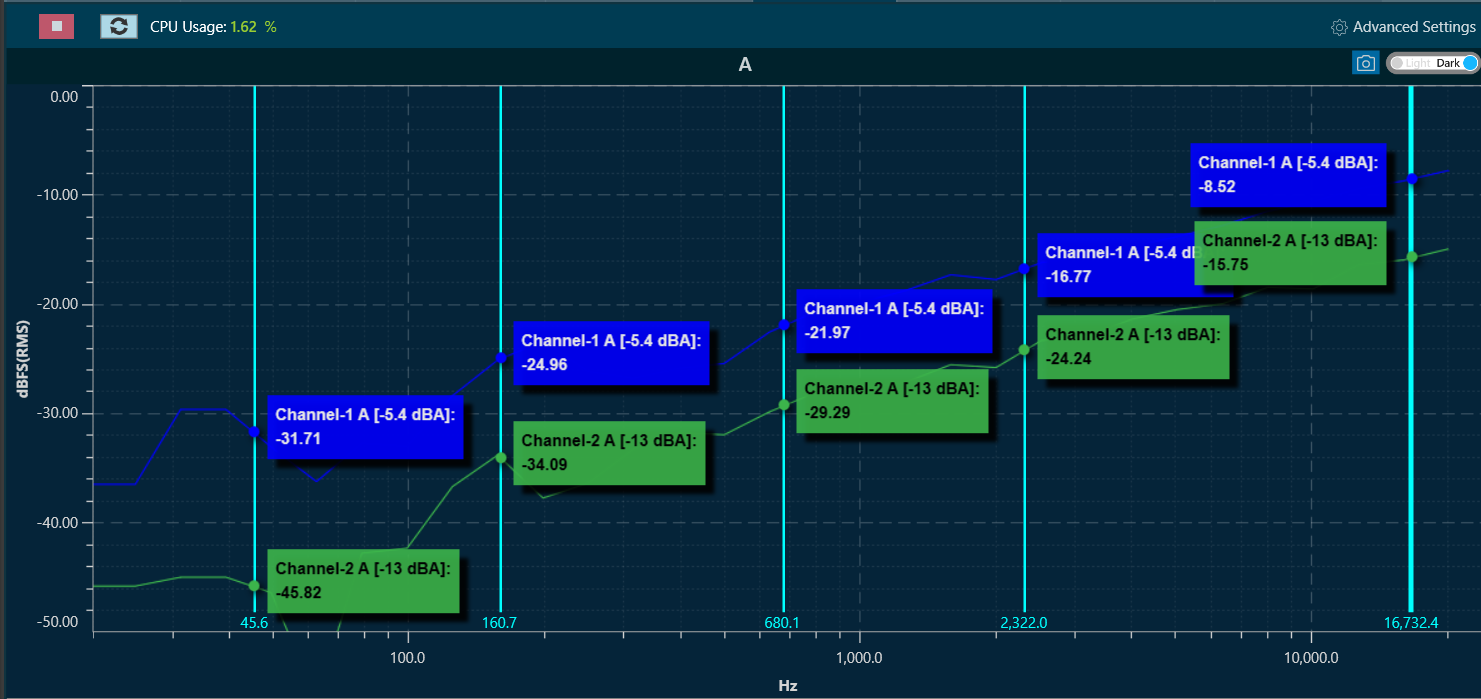
You can mark the curves for value inspection. Press CTRL + click, to create a marker. This marker will display the values of the traces as tooltips on top of the charts. It will show the values of all the traces.
A maximum of 5 markers can be placed on the chart.
To remove a marker, select the marker by clicking on top of it. The line of the marker will become wider, indicating it has been selected.
Add Delta Marker
Delta marker helpful in creating differential values for selected curves.
To add delta markers, press ALT + click on chart, and enable measurements from traces where delta values are desired.
The selected traces will display the following information:
- The value at the first marker.
- The value at the second marker.
- The delta (difference) between the markers.
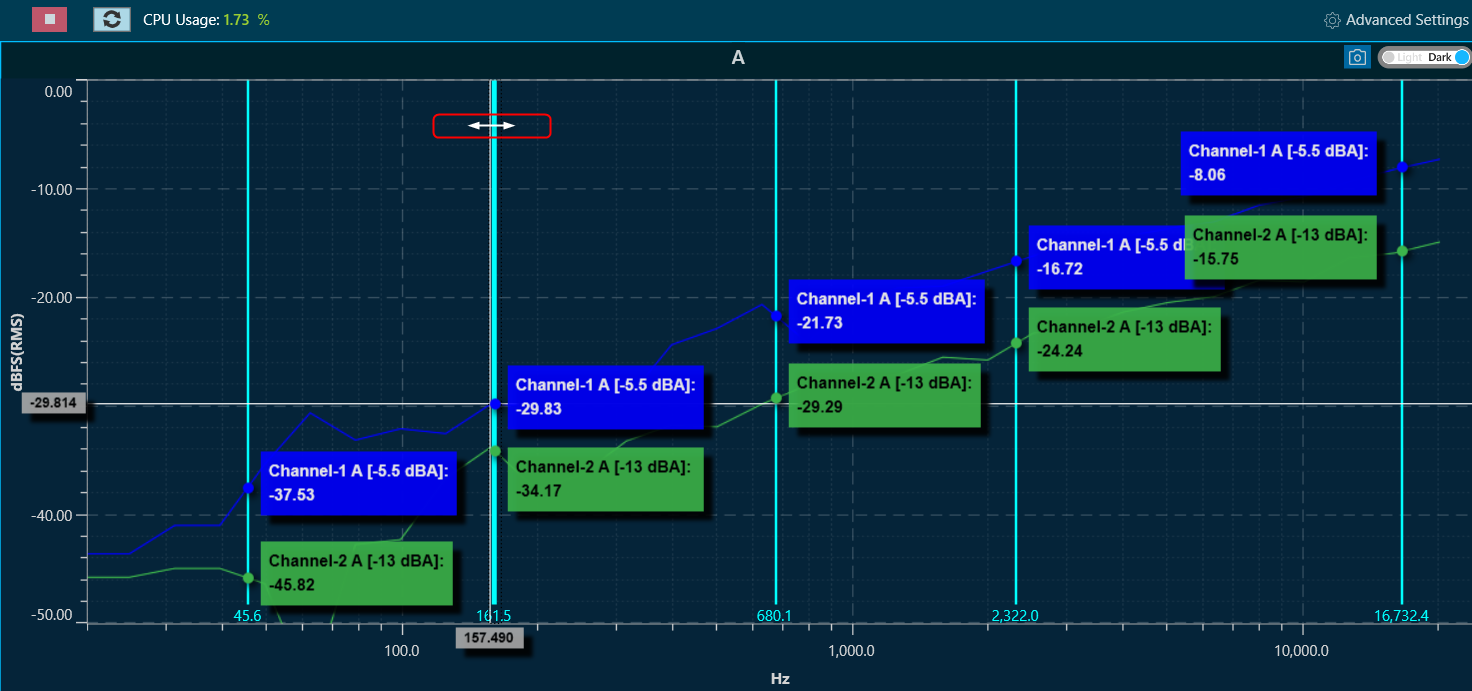
The values are indicated by the trace colour and highlighted with the marker colour. Delta markers can be dragged to the desired X position.
To disable Delta markers, press ALT + Click again.
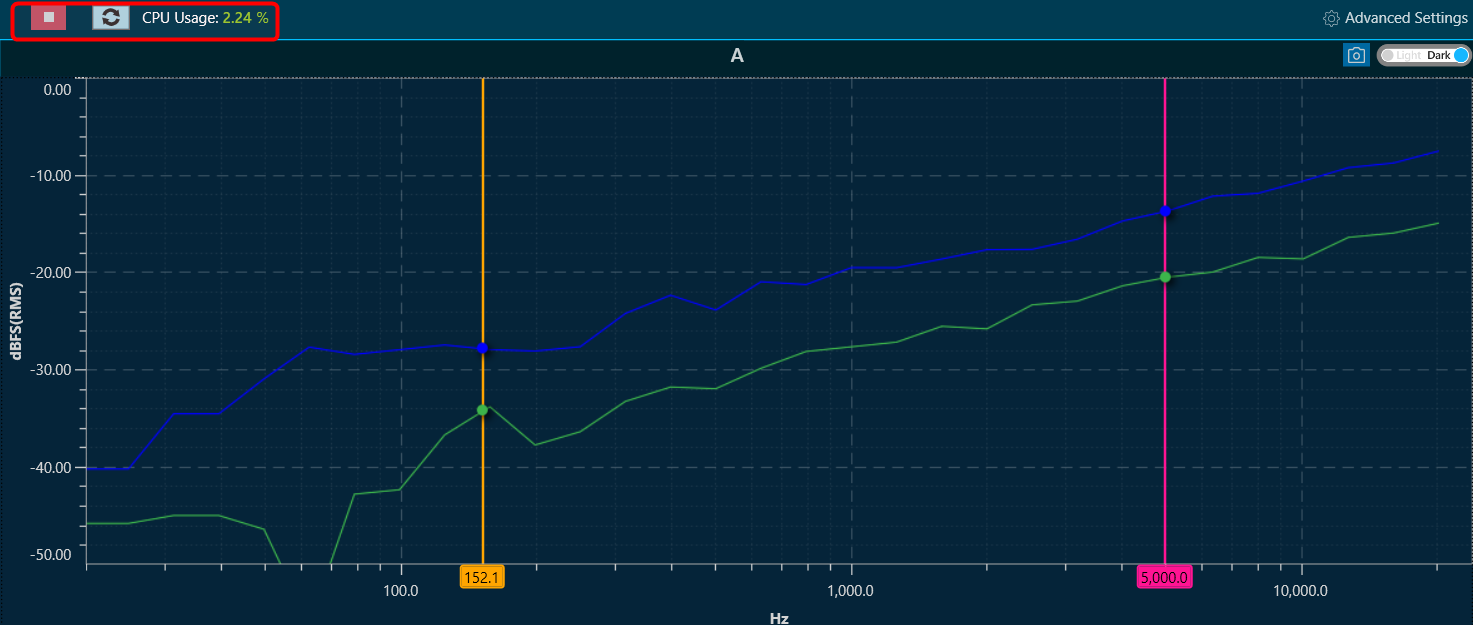
Refresh Spectrum
In the spectrum and multiplexer modes, the spectrum refresh button will update all curves displayed, excluding the traces. This functionality allows for the resetting of averaging time periods, which is particularly significant for “forever” averaging.
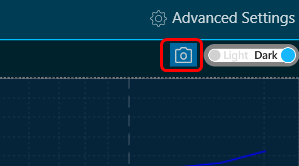
Capture Graph Image
The Export Image feature allows you to export the graphs and certain other details based on export setting configuration. The exported image file will be available in .png or .jpeg format.
Once you click on the “Export to Image” option, export setting window for the image will open.
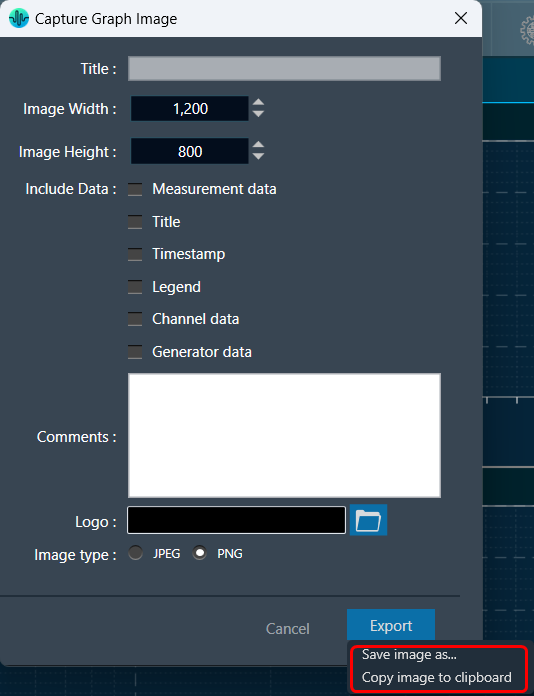
This export setting window includes following options:
- Title – Enter the image name.
- Image Width – Change the image width.
- Image Height – Change the image height.
- Include Data – Select the option to add various type of data such as Measurement data, Title, Timestamp, Legend, Channel data, Generator data in the image.
- Comments – Enter the specific comment, that you want to be add in the image.
- Logo – Add the desired logo in the image.
- Image type – Select the image type JPEG or PNG.
Once you configured export settings, click Export button. The context menu will show you two options, export the image or copy to the clipboard.
- Save image as – option will be opened to save the image to a file.
- Copy image to clipboard – will allow you to paste the graph image somewhere else.
Not possible to copy image to clipboard for graph B in case of link mode.
The exported image will have following sections based on export setting window configuration.
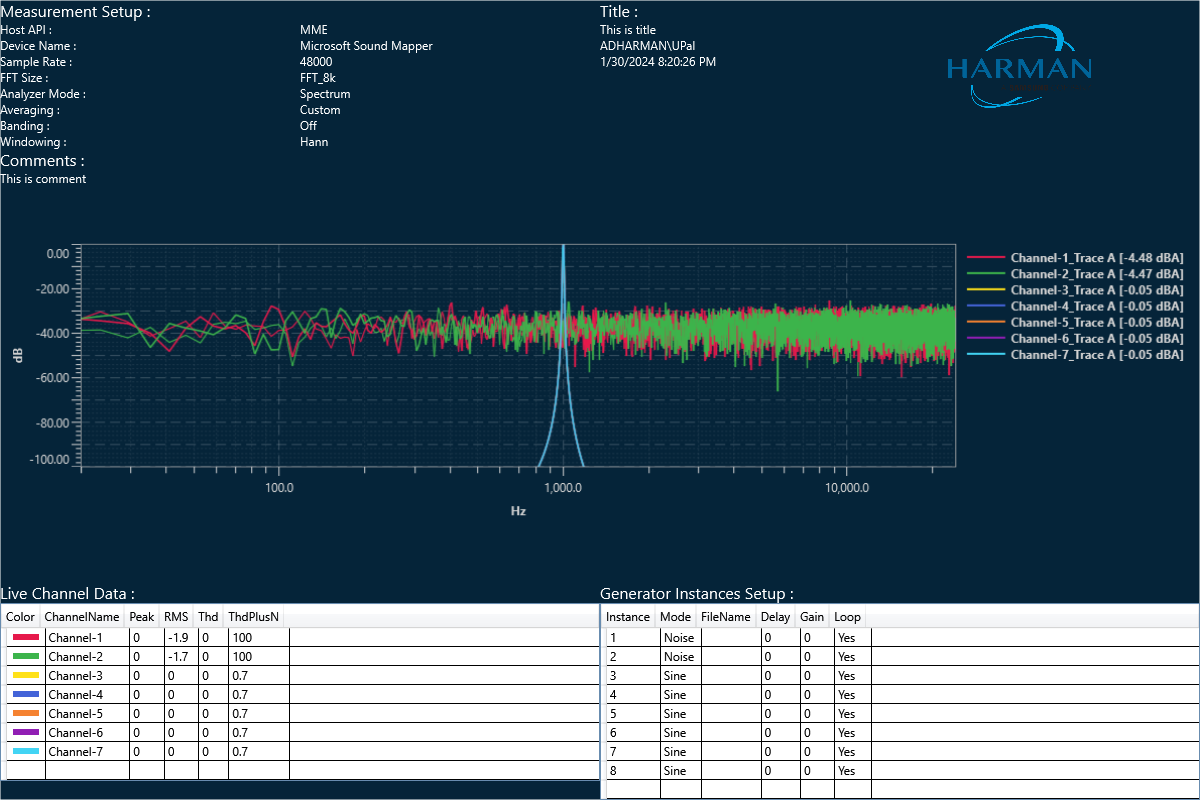
The graph always present in the exported image. Based on the export setting configuration additional sections like – Measurement information, Title, Time, User details, Logo provided, Live channel data, Generator instances details also present in the exported image .
If you select the “Channel data” checkbox, then in the “Legend” live channel entries will not appear, only traces will appear. Otherwise, all items will appear in Legend.
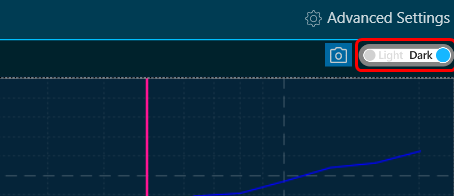
Graph Theme
There is a Toggle button (dark / light theme) in the charts in RTA graph. Once the Toggle button is clicked, the corresponding custom theme can be selected, and the background of the graph gets changed and vice versa.
|
Dark Theam
|
|
Light Theam
|