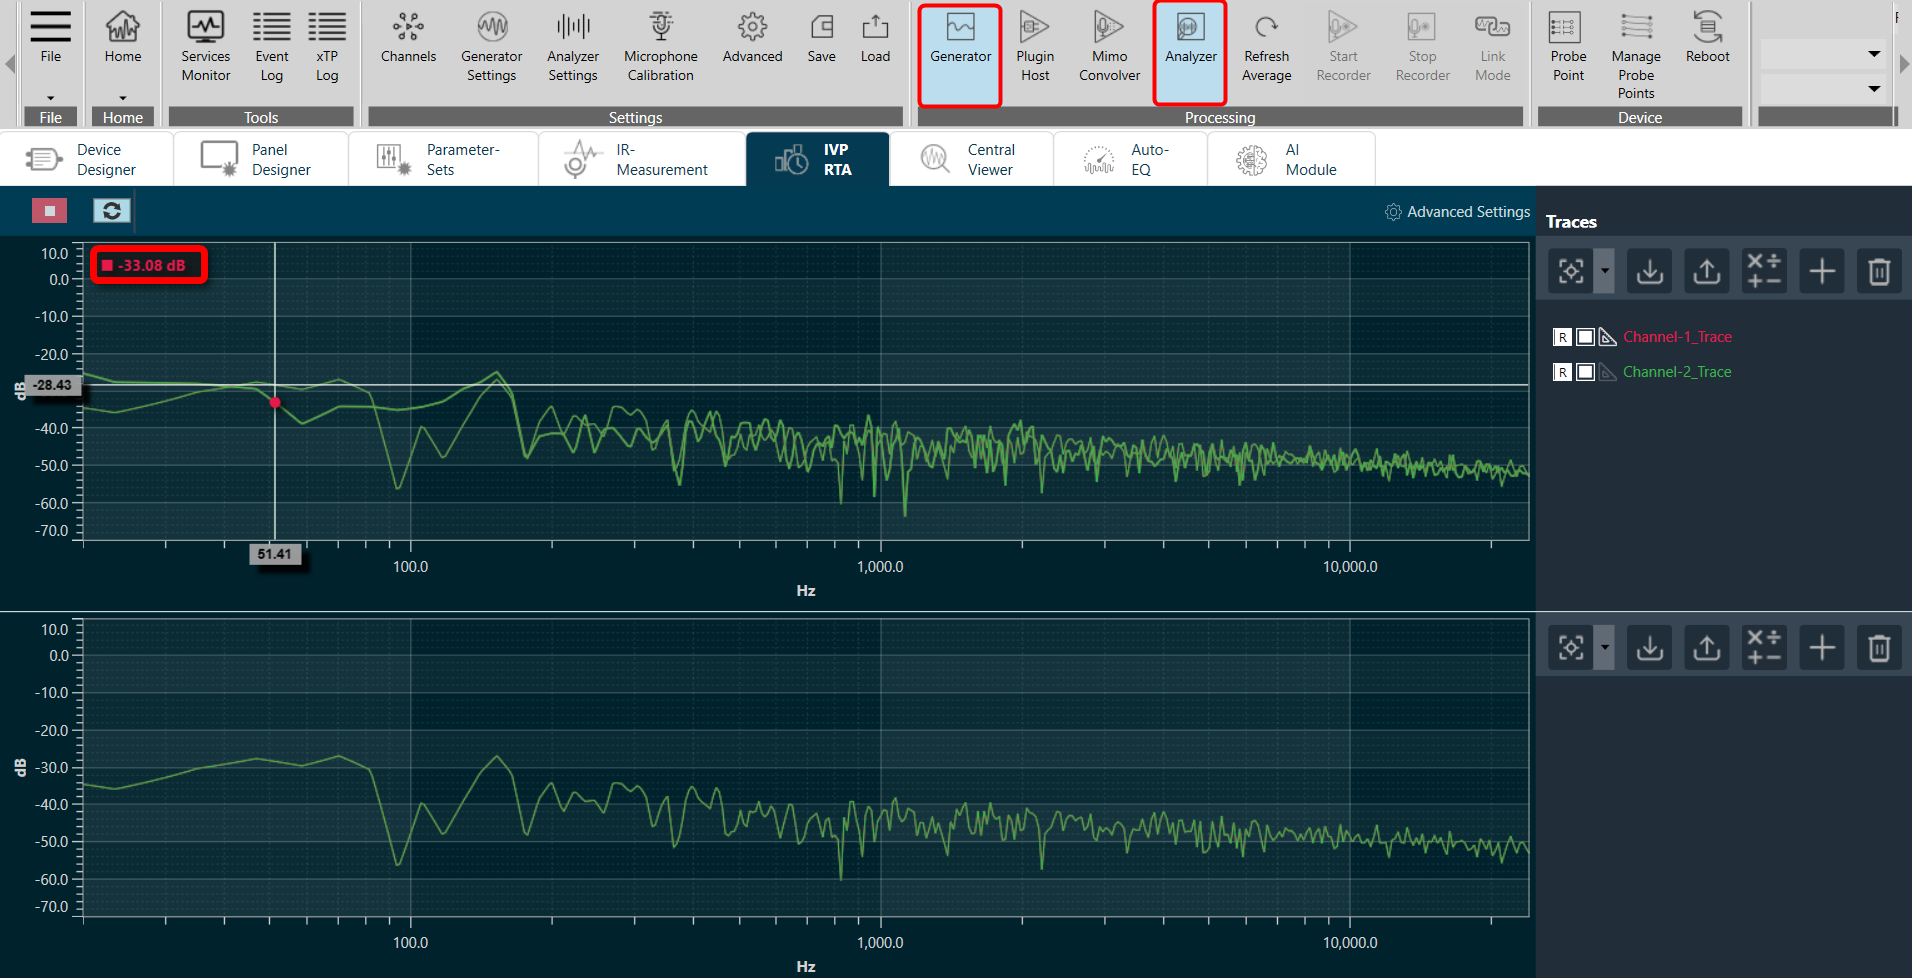
Cursor Measurements
Mouse hovering on any of curve/plots on graph will display horizontal and vertical values of the X and Y positions pointed to. It is important to know that while X value will follow mouse pointer, Y value will show closest trace (as in image below).
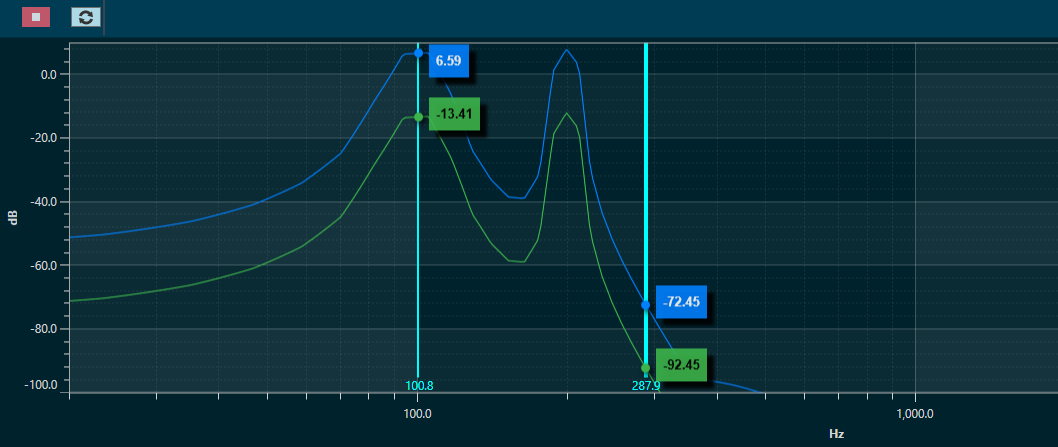
Markers for quick curves values inspection:
- By pressing CTRL+Click, a marker is created. Such marker will display values of traces (see image).
- Marker will display all trace’s values as tooltips on top of charts.
- A maximum of 5 Markers can be placed on the chart.
- To remove a Markers, select marker by clicking on top of it (line will become wider, as seen in Marker@287.9Hz on image), and press DEL.
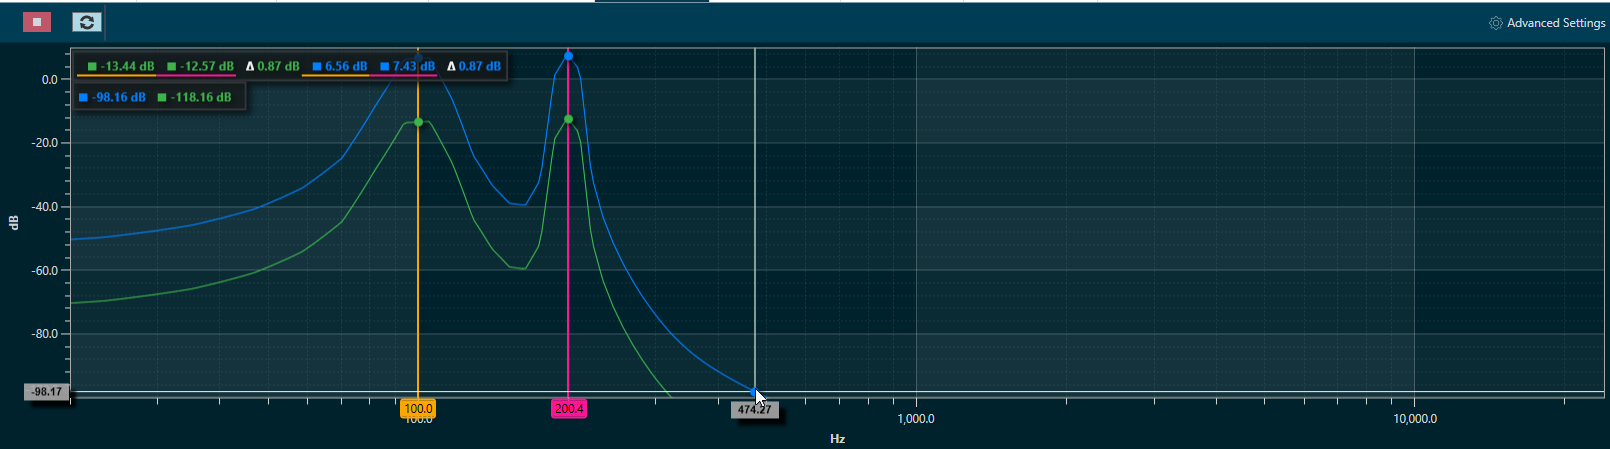
Delta Markers (Differential values) for selected curves can be identified as follows :
- To enable Delta Markers, press ALT+Click on chart.
- Enable measurements from traces where delta values are desired.
- Selected traces will display: value on first marker, value on second marker and delta between markers (see image).
- Values are in color of trace and underlined with color of marker. Delta markers can be dragged to desired X position.
- To disable Delta markers, press ALT+Click again.
Refresh Spectrum
The spectrum refresh button will refresh all curves (not the traces) on display in the spectrum and multiplexer modes. This feature can be used to restart the averaging time periods (especially important for “forever” averaging).
![]()