A trace in RTA is a captured measurement curve.
Traces allow for the display of multiple captures measurement curves on the same plot for the quick comparison of measurements. The controls for traces are located on the right side of the spectrum graph.
There are six different kinds of traces:
- Spectrum – Complete data set from measurement without phase
- Phase – Complete data set from measurement with phase data
- Txt – Data imported from a text file (tab separated frequency – spectrum value pairs per line)
- Ovl – Data imported from an Overlay file format
- Eq – Target curve, a spectrum curve described by biquad filter parameters
- Peak Hold – Peak hold trace with three time constants
Traces view is available only in Frequency Domain analyzer modes like Spectrum, Phase i.e, it is not available in Time Domain.
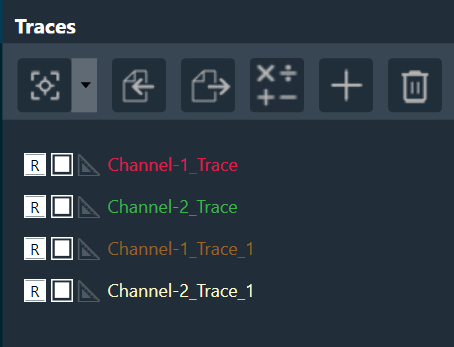
The trace menu is comprised of a trace toolbar and a trace list
Every trace list entry has a button for re-capture, a checkbox for selection and a trace label. The selection checkbox marks the trace for math operations.
A double-click on the trace label opens the trace property dialog:
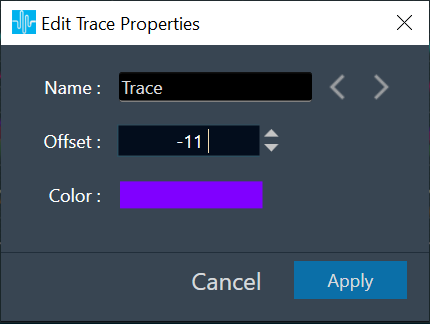
In this dialog, the name, the offset, and the color of the trace can be set. There are next and back buttons in the dialog so that user can navigate through multiple traces to edit them at a single time.
The Trace Toolbar consists of several buttons:
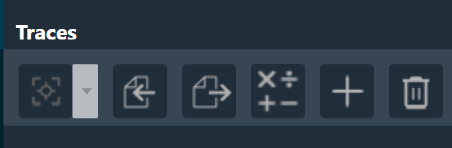
The Capture button provides two options:
-
- Click on button: Capture all traces
- Drop-down menu: Capture individual traces
The Import button offers a drop-down menu to import single traces (*.trace) or multiple traces (*.trclist).
The Export button offers a drop-down menu to export the highlighted trace (*.trace), the selected trace(s) or all traces (both to *.trclist).
The Add Math Operation button offers a drop-down menu to generate an unweighted average, a difference or a sum trace from the selected traces.
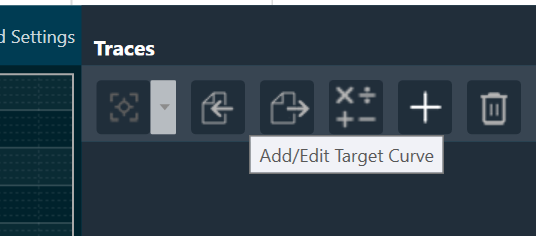
The Add Target Curve button opens the target curve design dialog.
The Delete button offers a drop-down menu to delete the highlighted, all traces. The deletion has to be confirmed.
A Target Curve can be added by pressing on the “+” button on menu.
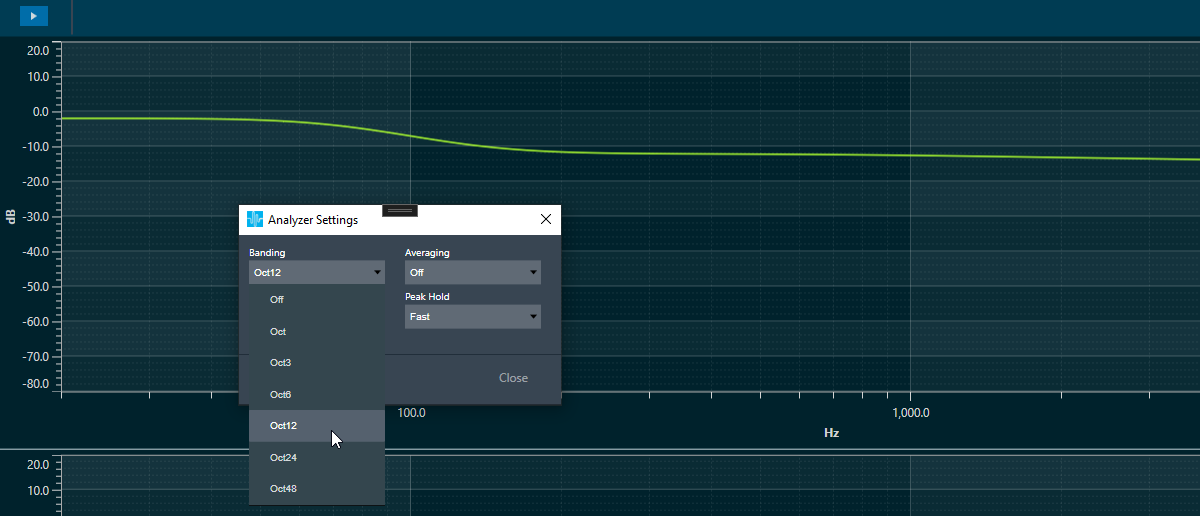
Once target curve is active, its offset will change by 3dB for every jump on octave banding configuration, to follow the behavior of the energetic sum of the octave banding.
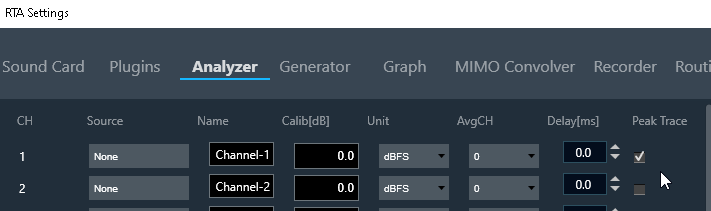
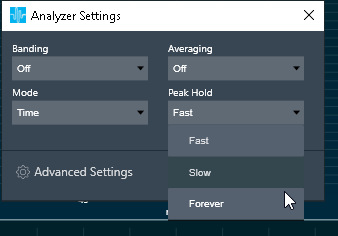
The Peak Hold Trace can be activated using a checkbox in the Advanced Analyzer menu. It’s time constants Forever, Slow, Fast can be selected in the normal Analyzer Settings Menu. The peak hold trace is reset by choosing Delete for the corresponding trace in the trace list.
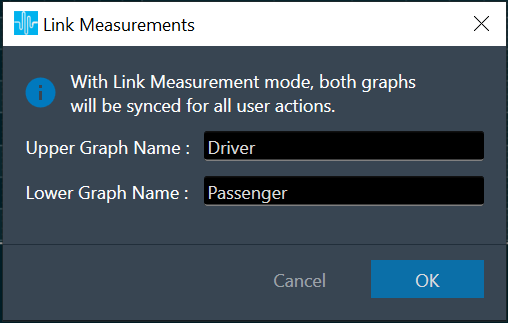
The Link Mode button is present for the Average channels, Multiplexer mode. This button enables the user to link the measurements from both upper and lower graphs in the RTA screen by allowing trace capture and other operations on traces simultaneously on both graphs. On clicking this button, the user will be presented with an option to provide the name of the charts from below window. Once the linking is activated, any operation performed on the Traces in the upper graph, will be reflected in the lower graph. The upper graph will refer to Average channel 1 and lower graph will refer to Average channel 2.