Graph display settings can be done by clicking Graph tab in RTA settings menu
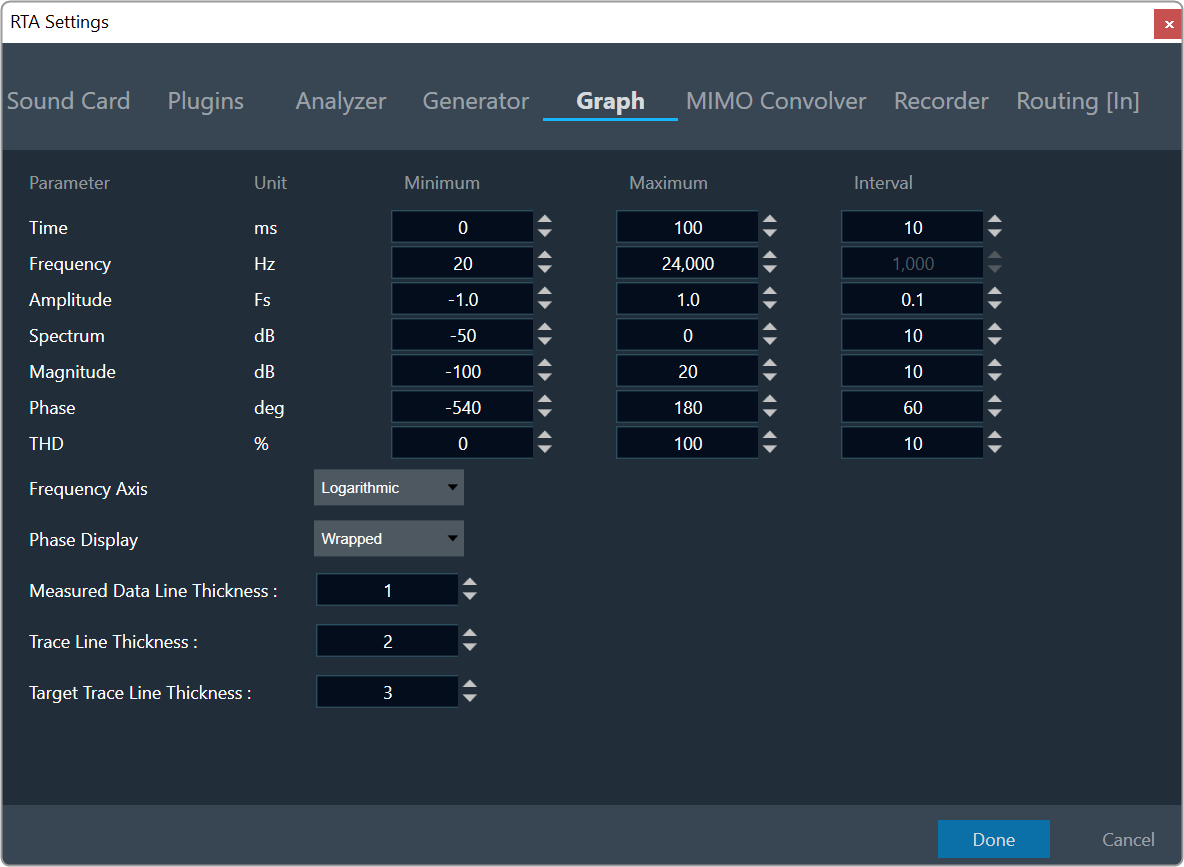
- Min and Max are used to set the Minimum and Maximum value of the Time/Amplitude/Frequency/Spectrum axes
- Interval sets the delta of horizontal/vertical labels
- Frequency axis can be set to Logarithmic or Linear via combo box
- Curve Line thickness can be changed for Measured data, Traces and Target Traces.
- Graph settings will be saved on click of Done and persist values on Import/export of project
Interval will be disabled for Log Scale