A click on the Channels button in the ribbon bar opens the Channel Viewer window. In this window the numerical measurements are displayed for each channel.
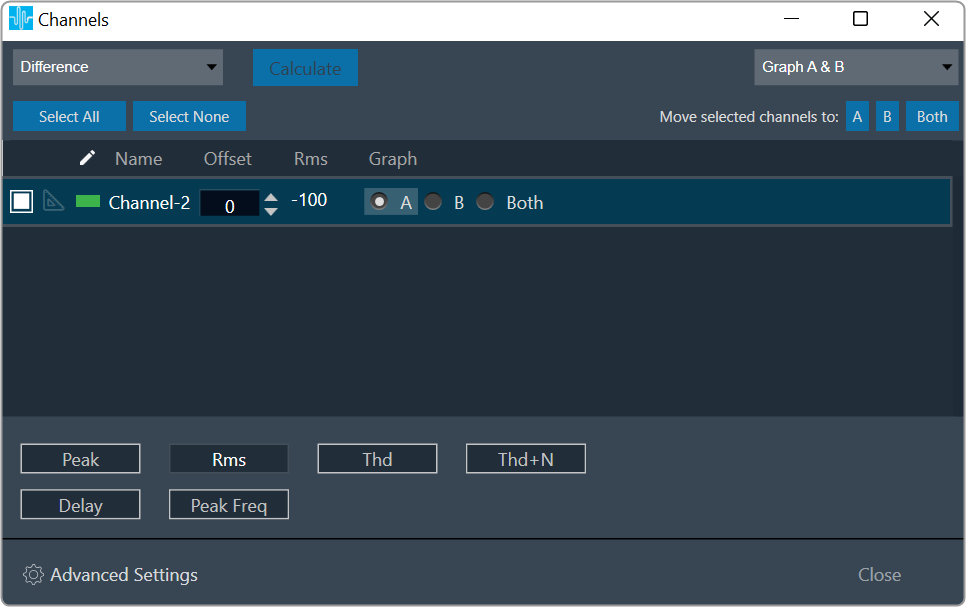
The channel viewer list contains following columns
- The first column indicates channel color. This provide an ability to change the color of channel by clicking on the color box.
- Name: This is the name set in the Analyzer Settings dialog
- Peak: The peak amplitude of the current block of analyzed audio samples
- Rms: The sound level meter value, unit as set in the Analyzer Settings (dBFS, dBV, dBSPL)
- Thd: Total harmonic distortion in %
- Thd+N: Total harmonic distortion plus noise in %
- Peak Freq: The frequency of the maximum level in the measured spectrum in Hz
- Delay : This value is calculated if Analyzer mode is ‘Delay’. The delay measurement is done by cross correlation between a reference channel and a channel which contains the reference signal which went through a certain path (e.g. amp – speaker – microphone). From the position of the maximum within the correlation result the delay can be calculated.
- Offset : +/- Db shifting of measured and math operated channels.
- Graph: Radio buttons allow to quickly select the graph where that channel is displayed.
With the buttons Peak, Rms, Thd, Thd+N and Peak Freq the user can select which values are shown in the list.
Besides the individual channel assignment to a specific graph, a bulk assignment can be performed. If no channels are checked, you can use the button on the “Move all channels to: A, B, Both” to move all channels to desired graph. This will also move Calculated channels. If one or more channels are checked, those same buttons will move only selected channels to desired graph.
To check/uncheck all channels, buttons “Select All” and “Select None” can be used.
The selector control in the top left of the window allows to select which group of channels are shown in the list: all channels (Graph A & B), Graph A channels only or Graph B channels only
The channel window is configured to stay on top and to be re-sizeable to conveniently be kept open for value observation during normal RTA opration.
Math operation on Measured channels
Select any two channels
Click on ‘Calculate’ button to get math operation result
Resulted math operated channel is listed on same view
User can delete Math operated channel and as an tool tip you can find which channels selected for math operations.
Only one Math operated channel can be created for combinations of measured channels.